Barbadian vs Immigrants from Ukraine 11th Grade
COMPARE
Barbadian
Immigrants from Ukraine
11th Grade
11th Grade Comparison
Barbadians
Immigrants from Ukraine
90.8%
11TH GRADE
0.0/ 100
METRIC RATING
279th/ 347
METRIC RANK
93.0%
11TH GRADE
89.8/ 100
METRIC RATING
129th/ 347
METRIC RANK
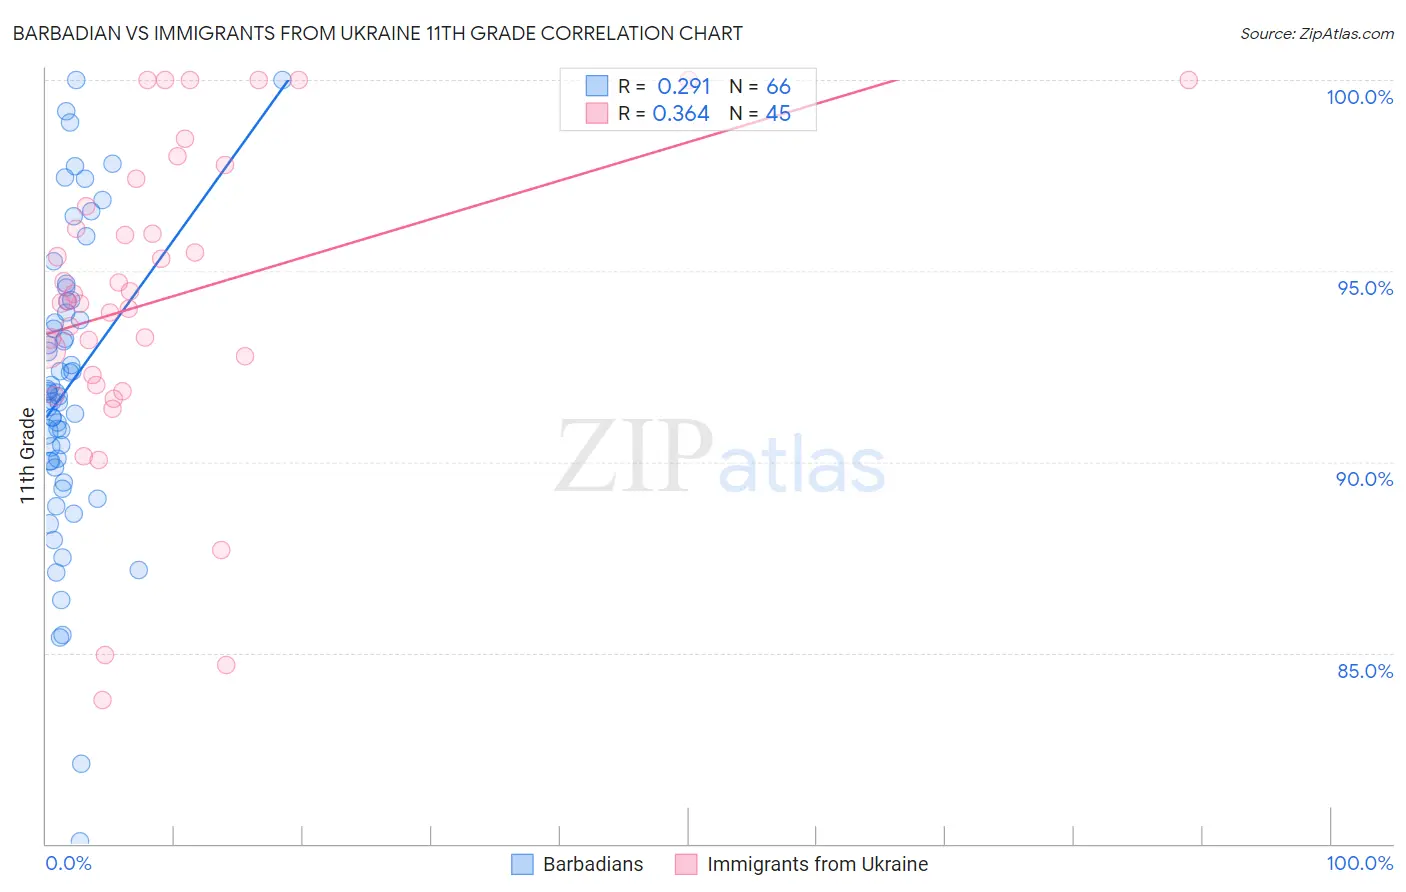
Barbadian vs Immigrants from Ukraine 11th Grade Correlation Chart
The statistical analysis conducted on geographies consisting of 141,304,456 people shows a weak positive correlation between the proportion of Barbadians and percentage of population with at least 11th grade education in the United States with a correlation coefficient (R) of 0.291 and weighted average of 90.8%. Similarly, the statistical analysis conducted on geographies consisting of 289,714,613 people shows a mild positive correlation between the proportion of Immigrants from Ukraine and percentage of population with at least 11th grade education in the United States with a correlation coefficient (R) of 0.364 and weighted average of 93.0%, a difference of 2.5%.
11th Grade Correlation Summary
| Measurement | Barbadian | Immigrants from Ukraine |
| Minimum | 80.1% | 83.8% |
| Maximum | 100.0% | 100.0% |
| Range | 19.9% | 16.2% |
| Mean | 92.0% | 94.3% |
| Median | 91.8% | 94.2% |
| Interquartile 25% (IQ1) | 90.0% | 92.1% |
| Interquartile 75% (IQ3) | 94.2% | 97.1% |
| Interquartile Range (IQR) | 4.2% | 4.9% |
| Standard Deviation (Sample) | 3.9% | 4.0% |
| Standard Deviation (Population) | 3.9% | 4.0% |
Similar Demographics by 11th Grade
Demographics Similar to Barbadians by 11th Grade
In terms of 11th grade, the demographic groups most similar to Barbadians are Malaysian (90.8%, a difference of 0.040%), Sri Lankan (90.7%, a difference of 0.060%), Immigrants from Congo (90.9%, a difference of 0.080%), Bangladeshi (90.9%, a difference of 0.10%), and Dutch West Indian (90.7%, a difference of 0.12%).
| Demographics | Rating | Rank | 11th Grade |
| West Indians | 0.1 /100 | #272 | Tragic 91.0% |
| Paiute | 0.1 /100 | #273 | Tragic 91.0% |
| Immigrants | Trinidad and Tobago | 0.1 /100 | #274 | Tragic 90.9% |
| Immigrants | South Eastern Asia | 0.1 /100 | #275 | Tragic 90.9% |
| Bangladeshis | 0.1 /100 | #276 | Tragic 90.9% |
| Immigrants | Congo | 0.1 /100 | #277 | Tragic 90.9% |
| Malaysians | 0.1 /100 | #278 | Tragic 90.8% |
| Barbadians | 0.0 /100 | #279 | Tragic 90.8% |
| Sri Lankans | 0.0 /100 | #280 | Tragic 90.7% |
| Dutch West Indians | 0.0 /100 | #281 | Tragic 90.7% |
| Immigrants | St. Vincent and the Grenadines | 0.0 /100 | #282 | Tragic 90.7% |
| Immigrants | Barbados | 0.0 /100 | #283 | Tragic 90.7% |
| Immigrants | Laos | 0.0 /100 | #284 | Tragic 90.5% |
| Immigrants | Burma/Myanmar | 0.0 /100 | #285 | Tragic 90.4% |
| Immigrants | West Indies | 0.0 /100 | #286 | Tragic 90.4% |
Demographics Similar to Immigrants from Ukraine by 11th Grade
In terms of 11th grade, the demographic groups most similar to Immigrants from Ukraine are Albanian (93.0%, a difference of 0.010%), Egyptian (93.0%, a difference of 0.010%), Immigrants from Bosnia and Herzegovina (93.0%, a difference of 0.020%), Mongolian (93.0%, a difference of 0.050%), and Delaware (93.0%, a difference of 0.060%).
| Demographics | Rating | Rank | 11th Grade |
| Immigrants | Belarus | 96.3 /100 | #122 | Exceptional 93.3% |
| Immigrants | Greece | 95.9 /100 | #123 | Exceptional 93.2% |
| Immigrants | Eastern Europe | 95.9 /100 | #124 | Exceptional 93.2% |
| Immigrants | Sri Lanka | 95.6 /100 | #125 | Exceptional 93.2% |
| Basques | 95.2 /100 | #126 | Exceptional 93.2% |
| Immigrants | Kazakhstan | 92.4 /100 | #127 | Exceptional 93.1% |
| Immigrants | Jordan | 92.4 /100 | #128 | Exceptional 93.1% |
| Immigrants | Ukraine | 89.8 /100 | #129 | Excellent 93.0% |
| Albanians | 89.5 /100 | #130 | Excellent 93.0% |
| Egyptians | 89.5 /100 | #131 | Excellent 93.0% |
| Immigrants | Bosnia and Herzegovina | 89.0 /100 | #132 | Excellent 93.0% |
| Mongolians | 87.6 /100 | #133 | Excellent 93.0% |
| Delaware | 87.3 /100 | #134 | Excellent 93.0% |
| Immigrants | Italy | 86.6 /100 | #135 | Excellent 92.9% |
| Cree | 85.9 /100 | #136 | Excellent 92.9% |