Barbadian vs Immigrants from Chile 11th Grade
COMPARE
Barbadian
Immigrants from Chile
11th Grade
11th Grade Comparison
Barbadians
Immigrants from Chile
90.8%
11TH GRADE
0.0/ 100
METRIC RATING
279th/ 347
METRIC RANK
92.4%
11TH GRADE
33.3/ 100
METRIC RATING
189th/ 347
METRIC RANK
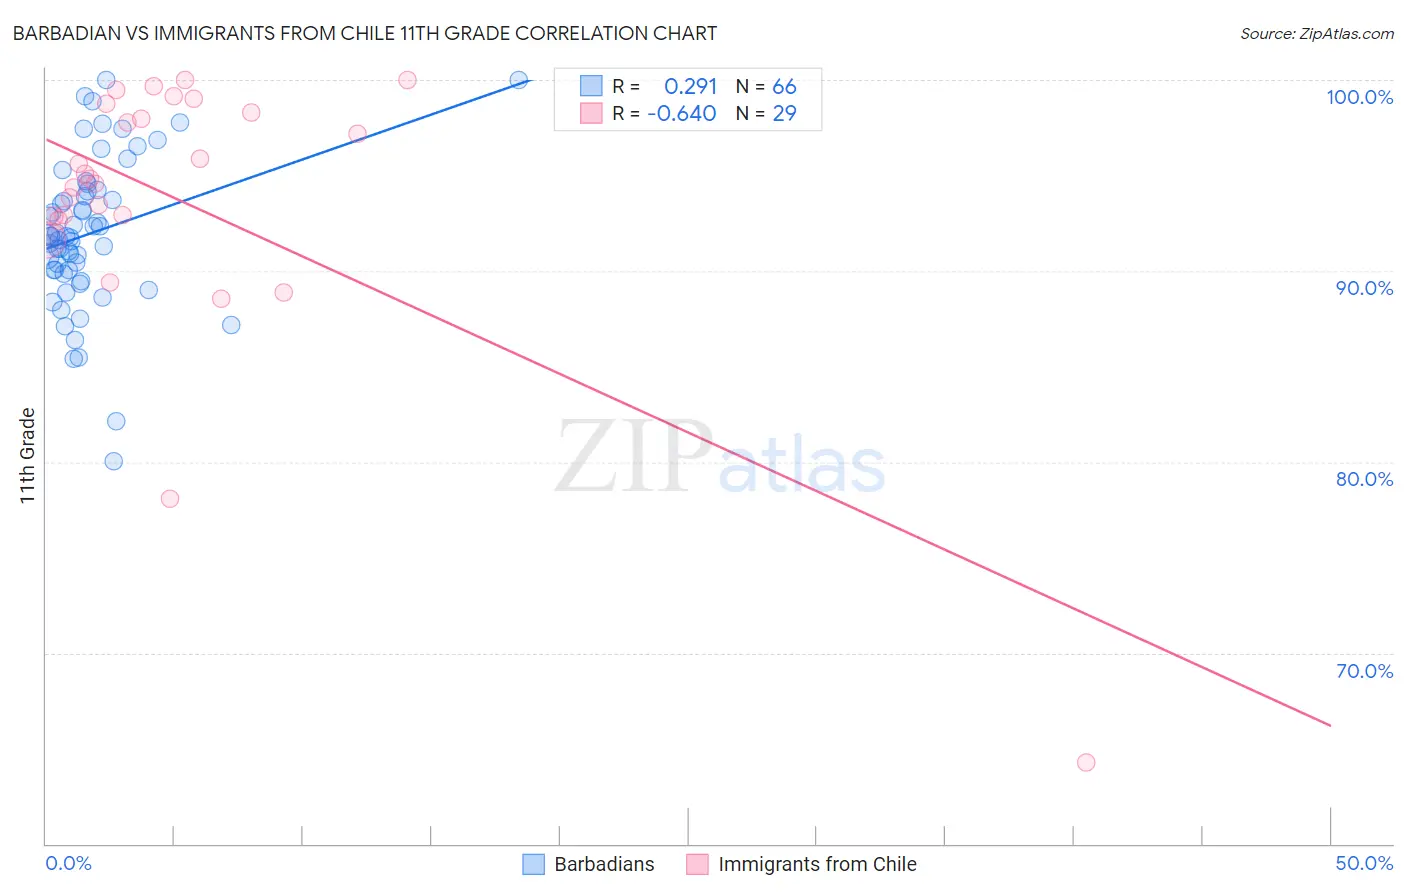
Barbadian vs Immigrants from Chile 11th Grade Correlation Chart
The statistical analysis conducted on geographies consisting of 141,304,456 people shows a weak positive correlation between the proportion of Barbadians and percentage of population with at least 11th grade education in the United States with a correlation coefficient (R) of 0.291 and weighted average of 90.8%. Similarly, the statistical analysis conducted on geographies consisting of 218,647,266 people shows a significant negative correlation between the proportion of Immigrants from Chile and percentage of population with at least 11th grade education in the United States with a correlation coefficient (R) of -0.640 and weighted average of 92.4%, a difference of 1.7%.
11th Grade Correlation Summary
| Measurement | Barbadian | Immigrants from Chile |
| Minimum | 80.1% | 64.3% |
| Maximum | 100.0% | 100.0% |
| Range | 19.9% | 35.7% |
| Mean | 92.0% | 93.7% |
| Median | 91.8% | 94.8% |
| Interquartile 25% (IQ1) | 90.0% | 92.8% |
| Interquartile 75% (IQ3) | 94.2% | 98.5% |
| Interquartile Range (IQR) | 4.2% | 5.8% |
| Standard Deviation (Sample) | 3.9% | 7.3% |
| Standard Deviation (Population) | 3.9% | 7.2% |
Similar Demographics by 11th Grade
Demographics Similar to Barbadians by 11th Grade
In terms of 11th grade, the demographic groups most similar to Barbadians are Malaysian (90.8%, a difference of 0.040%), Sri Lankan (90.7%, a difference of 0.060%), Immigrants from Congo (90.9%, a difference of 0.080%), Bangladeshi (90.9%, a difference of 0.10%), and Dutch West Indian (90.7%, a difference of 0.12%).
| Demographics | Rating | Rank | 11th Grade |
| West Indians | 0.1 /100 | #272 | Tragic 91.0% |
| Paiute | 0.1 /100 | #273 | Tragic 91.0% |
| Immigrants | Trinidad and Tobago | 0.1 /100 | #274 | Tragic 90.9% |
| Immigrants | South Eastern Asia | 0.1 /100 | #275 | Tragic 90.9% |
| Bangladeshis | 0.1 /100 | #276 | Tragic 90.9% |
| Immigrants | Congo | 0.1 /100 | #277 | Tragic 90.9% |
| Malaysians | 0.1 /100 | #278 | Tragic 90.8% |
| Barbadians | 0.0 /100 | #279 | Tragic 90.8% |
| Sri Lankans | 0.0 /100 | #280 | Tragic 90.7% |
| Dutch West Indians | 0.0 /100 | #281 | Tragic 90.7% |
| Immigrants | St. Vincent and the Grenadines | 0.0 /100 | #282 | Tragic 90.7% |
| Immigrants | Barbados | 0.0 /100 | #283 | Tragic 90.7% |
| Immigrants | Laos | 0.0 /100 | #284 | Tragic 90.5% |
| Immigrants | Burma/Myanmar | 0.0 /100 | #285 | Tragic 90.4% |
| Immigrants | West Indies | 0.0 /100 | #286 | Tragic 90.4% |
Demographics Similar to Immigrants from Chile by 11th Grade
In terms of 11th grade, the demographic groups most similar to Immigrants from Chile are Immigrants from Indonesia (92.4%, a difference of 0.0%), Arapaho (92.4%, a difference of 0.020%), Immigrants from Western Asia (92.4%, a difference of 0.020%), Chickasaw (92.3%, a difference of 0.020%), and Immigrants from Nepal (92.4%, a difference of 0.030%).
| Demographics | Rating | Rank | 11th Grade |
| Immigrants | Morocco | 38.6 /100 | #182 | Fair 92.4% |
| Immigrants | Malaysia | 37.6 /100 | #183 | Fair 92.4% |
| Immigrants | Asia | 37.4 /100 | #184 | Fair 92.4% |
| Immigrants | Nepal | 36.4 /100 | #185 | Fair 92.4% |
| Arapaho | 35.1 /100 | #186 | Fair 92.4% |
| Immigrants | Western Asia | 35.0 /100 | #187 | Fair 92.4% |
| Immigrants | Indonesia | 33.7 /100 | #188 | Fair 92.4% |
| Immigrants | Chile | 33.3 /100 | #189 | Fair 92.4% |
| Chickasaw | 31.4 /100 | #190 | Fair 92.3% |
| French American Indians | 30.8 /100 | #191 | Fair 92.3% |
| Immigrants | Syria | 30.4 /100 | #192 | Fair 92.3% |
| Moroccans | 28.7 /100 | #193 | Fair 92.3% |
| Sioux | 28.5 /100 | #194 | Fair 92.3% |
| Liberians | 26.8 /100 | #195 | Fair 92.3% |
| Panamanians | 26.4 /100 | #196 | Fair 92.3% |