Immigrants from Cameroon vs Immigrants from Oceania 11th Grade
COMPARE
Immigrants from Cameroon
Immigrants from Oceania
11th Grade
11th Grade Comparison
Immigrants from Cameroon
Immigrants from Oceania
91.8%
11TH GRADE
4.4/ 100
METRIC RATING
227th/ 347
METRIC RANK
92.2%
11TH GRADE
22.4/ 100
METRIC RATING
207th/ 347
METRIC RANK
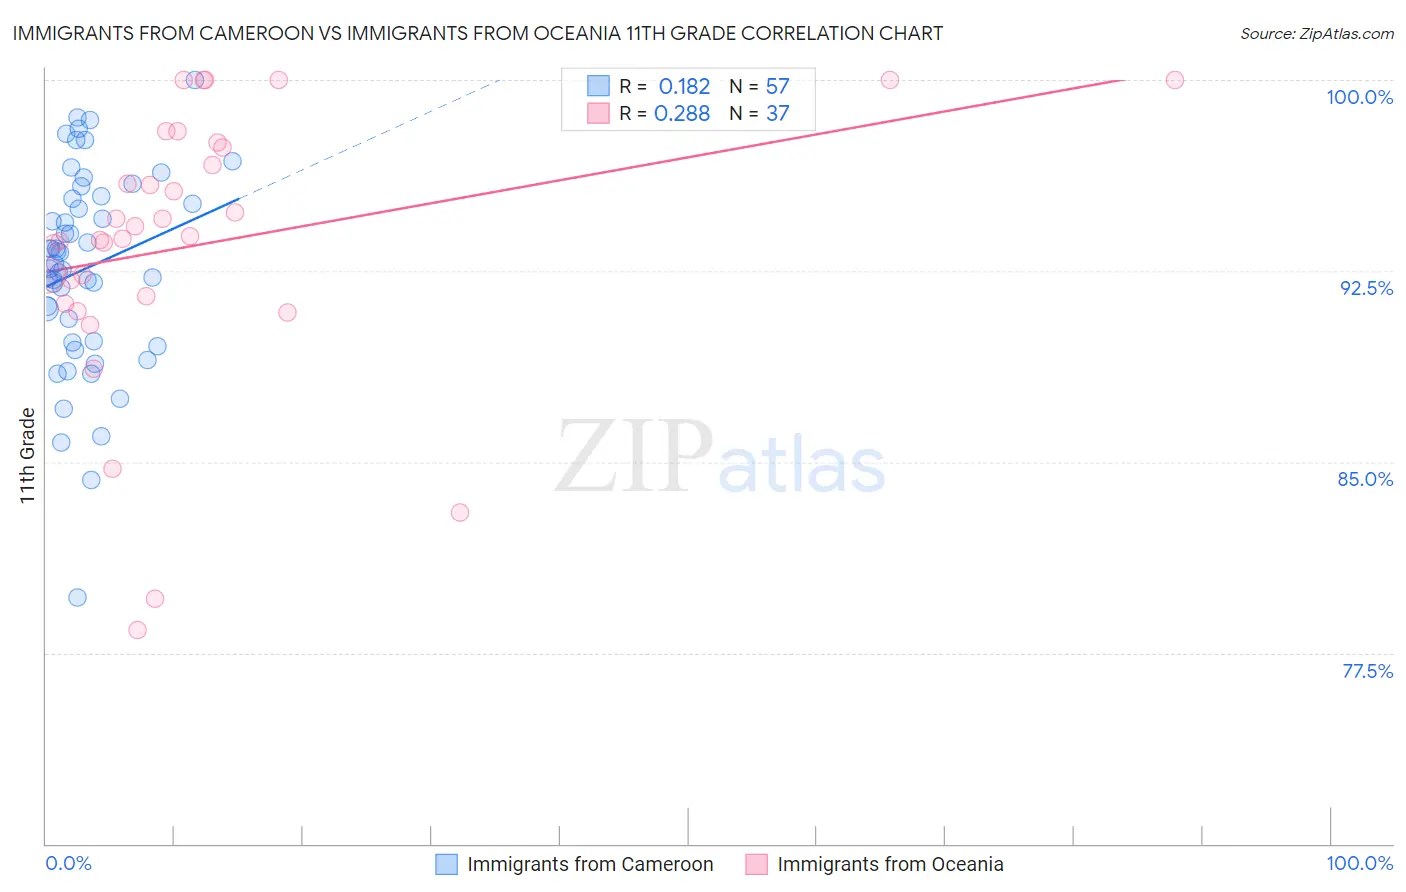
Immigrants from Cameroon vs Immigrants from Oceania 11th Grade Correlation Chart
The statistical analysis conducted on geographies consisting of 130,618,704 people shows a poor positive correlation between the proportion of Immigrants from Cameroon and percentage of population with at least 11th grade education in the United States with a correlation coefficient (R) of 0.182 and weighted average of 91.8%. Similarly, the statistical analysis conducted on geographies consisting of 305,521,521 people shows a weak positive correlation between the proportion of Immigrants from Oceania and percentage of population with at least 11th grade education in the United States with a correlation coefficient (R) of 0.288 and weighted average of 92.2%, a difference of 0.46%.
11th Grade Correlation Summary
| Measurement | Immigrants from Cameroon | Immigrants from Oceania |
| Minimum | 79.7% | 78.4% |
| Maximum | 100.0% | 100.0% |
| Range | 20.3% | 21.6% |
| Mean | 92.6% | 93.6% |
| Median | 92.8% | 93.8% |
| Interquartile 25% (IQ1) | 89.7% | 91.4% |
| Interquartile 75% (IQ3) | 95.4% | 97.5% |
| Interquartile Range (IQR) | 5.7% | 6.1% |
| Standard Deviation (Sample) | 3.9% | 5.3% |
| Standard Deviation (Population) | 3.9% | 5.3% |
Demographics Similar to Immigrants from Cameroon and Immigrants from Oceania by 11th Grade
In terms of 11th grade, the demographic groups most similar to Immigrants from Cameroon are Immigrants from Somalia (91.9%, a difference of 0.050%), Immigrants from Zaire (91.9%, a difference of 0.060%), Costa Rican (91.9%, a difference of 0.090%), Immigrants from Africa (91.9%, a difference of 0.10%), and Immigrants from Bahamas (91.9%, a difference of 0.10%). Similarly, the demographic groups most similar to Immigrants from Oceania are Colville (92.2%, a difference of 0.010%), Tongan (92.2%, a difference of 0.040%), Ethiopian (92.2%, a difference of 0.050%), Immigrants from Micronesia (92.2%, a difference of 0.070%), and Korean (92.1%, a difference of 0.13%).
| Demographics | Rating | Rank | 11th Grade |
| Immigrants | Oceania | 22.4 /100 | #207 | Fair 92.2% |
| Colville | 21.8 /100 | #208 | Fair 92.2% |
| Tongans | 19.8 /100 | #209 | Poor 92.2% |
| Ethiopians | 18.8 /100 | #210 | Poor 92.2% |
| Immigrants | Micronesia | 17.7 /100 | #211 | Poor 92.2% |
| Koreans | 14.4 /100 | #212 | Poor 92.1% |
| Immigrants | Ethiopia | 13.9 /100 | #213 | Poor 92.1% |
| Afghans | 12.8 /100 | #214 | Poor 92.1% |
| Immigrants | Southern Europe | 12.5 /100 | #215 | Poor 92.1% |
| Somalis | 11.6 /100 | #216 | Poor 92.1% |
| Immigrants | Sierra Leone | 11.1 /100 | #217 | Poor 92.0% |
| Blackfeet | 10.1 /100 | #218 | Poor 92.0% |
| Portuguese | 10.0 /100 | #219 | Tragic 92.0% |
| South American Indians | 7.6 /100 | #220 | Tragic 92.0% |
| Immigrants | Liberia | 7.0 /100 | #221 | Tragic 91.9% |
| Immigrants | Africa | 6.5 /100 | #222 | Tragic 91.9% |
| Immigrants | Bahamas | 6.5 /100 | #223 | Tragic 91.9% |
| Costa Ricans | 6.3 /100 | #224 | Tragic 91.9% |
| Immigrants | Zaire | 5.4 /100 | #225 | Tragic 91.9% |
| Immigrants | Somalia | 5.2 /100 | #226 | Tragic 91.9% |
| Immigrants | Cameroon | 4.4 /100 | #227 | Tragic 91.8% |