Immigrants from Northern Africa vs Immigrants from Albania College, 1 year or more
COMPARE
Immigrants from Northern Africa
Immigrants from Albania
College, 1 year or more
College, 1 year or more Comparison
Immigrants from Northern Africa
Immigrants from Albania
61.9%
COLLEGE, 1 YEAR OR MORE
95.7/ 100
METRIC RATING
109th/ 347
METRIC RANK
59.5%
COLLEGE, 1 YEAR OR MORE
52.3/ 100
METRIC RATING
171st/ 347
METRIC RANK
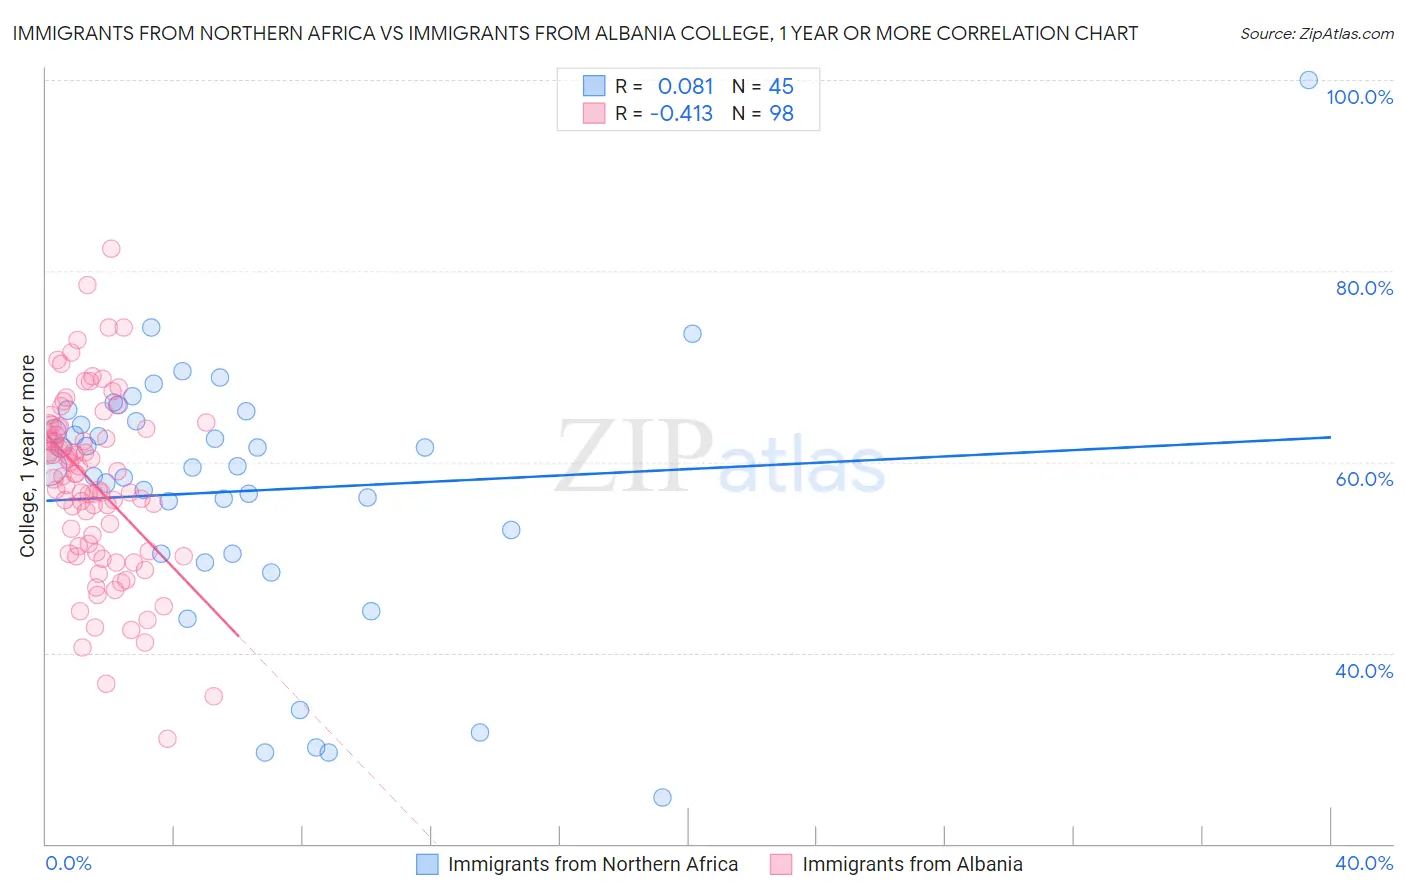
Immigrants from Northern Africa vs Immigrants from Albania College, 1 year or more Correlation Chart
The statistical analysis conducted on geographies consisting of 321,198,131 people shows a slight positive correlation between the proportion of Immigrants from Northern Africa and percentage of population with at least college, 1 year or more education in the United States with a correlation coefficient (R) of 0.081 and weighted average of 61.9%. Similarly, the statistical analysis conducted on geographies consisting of 119,397,636 people shows a moderate negative correlation between the proportion of Immigrants from Albania and percentage of population with at least college, 1 year or more education in the United States with a correlation coefficient (R) of -0.413 and weighted average of 59.5%, a difference of 4.0%.
College, 1 year or more Correlation Summary
| Measurement | Immigrants from Northern Africa | Immigrants from Albania |
| Minimum | 24.8% | 31.0% |
| Maximum | 100.0% | 82.3% |
| Range | 75.2% | 51.3% |
| Mean | 57.0% | 57.7% |
| Median | 59.4% | 58.6% |
| Interquartile 25% (IQ1) | 50.4% | 50.6% |
| Interquartile 75% (IQ3) | 64.8% | 63.6% |
| Interquartile Range (IQR) | 14.4% | 12.9% |
| Standard Deviation (Sample) | 14.0% | 9.4% |
| Standard Deviation (Population) | 13.8% | 9.3% |
Similar Demographics by College, 1 year or more
Demographics Similar to Immigrants from Northern Africa by College, 1 year or more
In terms of college, 1 year or more, the demographic groups most similar to Immigrants from Northern Africa are Syrian (61.9%, a difference of 0.0%), Immigrants from Ukraine (61.9%, a difference of 0.020%), European (61.8%, a difference of 0.020%), Macedonian (61.8%, a difference of 0.020%), and Austrian (61.8%, a difference of 0.080%).
| Demographics | Rating | Rank | College, 1 year or more |
| Luxembourgers | 96.7 /100 | #102 | Exceptional 62.1% |
| Afghans | 96.4 /100 | #103 | Exceptional 62.0% |
| Chileans | 96.4 /100 | #104 | Exceptional 62.0% |
| Immigrants | Nepal | 96.3 /100 | #105 | Exceptional 62.0% |
| Palestinians | 96.3 /100 | #106 | Exceptional 62.0% |
| Immigrants | Ukraine | 95.8 /100 | #107 | Exceptional 61.9% |
| Syrians | 95.7 /100 | #108 | Exceptional 61.9% |
| Immigrants | Northern Africa | 95.7 /100 | #109 | Exceptional 61.9% |
| Europeans | 95.6 /100 | #110 | Exceptional 61.8% |
| Macedonians | 95.6 /100 | #111 | Exceptional 61.8% |
| Austrians | 95.4 /100 | #112 | Exceptional 61.8% |
| Ukrainians | 95.2 /100 | #113 | Exceptional 61.8% |
| Danes | 94.8 /100 | #114 | Exceptional 61.7% |
| Norwegians | 94.5 /100 | #115 | Exceptional 61.7% |
| Lebanese | 94.1 /100 | #116 | Exceptional 61.6% |
Demographics Similar to Immigrants from Albania by College, 1 year or more
In terms of college, 1 year or more, the demographic groups most similar to Immigrants from Albania are Welsh (59.5%, a difference of 0.0%), Immigrants from Sierra Leone (59.5%, a difference of 0.010%), Immigrants from Southern Europe (59.5%, a difference of 0.020%), Hungarian (59.5%, a difference of 0.030%), and Immigrants from North Macedonia (59.5%, a difference of 0.040%).
| Demographics | Rating | Rank | College, 1 year or more |
| Belgians | 58.1 /100 | #164 | Average 59.7% |
| Irish | 56.1 /100 | #165 | Average 59.6% |
| Immigrants | Africa | 56.1 /100 | #166 | Average 59.6% |
| Immigrants | North Macedonia | 53.1 /100 | #167 | Average 59.5% |
| Hungarians | 52.9 /100 | #168 | Average 59.5% |
| Immigrants | Southern Europe | 52.7 /100 | #169 | Average 59.5% |
| Welsh | 52.4 /100 | #170 | Average 59.5% |
| Immigrants | Albania | 52.3 /100 | #171 | Average 59.5% |
| Immigrants | Sierra Leone | 52.2 /100 | #172 | Average 59.5% |
| Immigrants | Oceania | 51.2 /100 | #173 | Average 59.4% |
| Celtics | 50.0 /100 | #174 | Average 59.4% |
| Sri Lankans | 49.0 /100 | #175 | Average 59.4% |
| Immigrants | Poland | 48.9 /100 | #176 | Average 59.4% |
| Tlingit-Haida | 48.4 /100 | #177 | Average 59.4% |
| Czechoslovakians | 48.3 /100 | #178 | Average 59.4% |