Barbadian vs Immigrants from Albania 3rd Grade
COMPARE
Barbadian
Immigrants from Albania
3rd Grade
3rd Grade Comparison
Barbadians
Immigrants from Albania
97.2%
3RD GRADE
0.1/ 100
METRIC RATING
281st/ 347
METRIC RANK
97.7%
3RD GRADE
22.6/ 100
METRIC RATING
200th/ 347
METRIC RANK
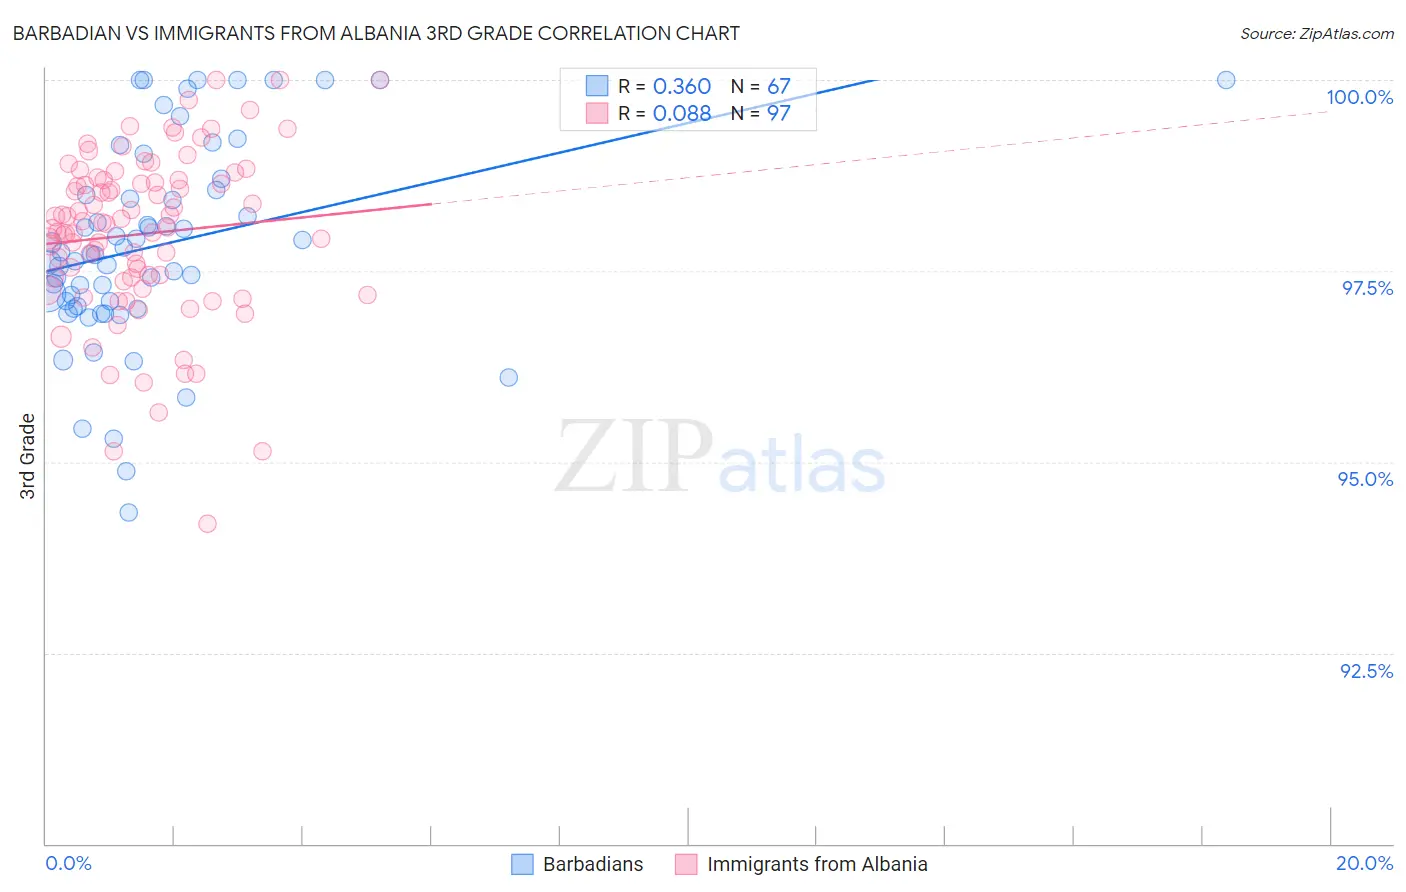
Barbadian vs Immigrants from Albania 3rd Grade Correlation Chart
The statistical analysis conducted on geographies consisting of 141,304,590 people shows a mild positive correlation between the proportion of Barbadians and percentage of population with at least 3rd grade education in the United States with a correlation coefficient (R) of 0.360 and weighted average of 97.2%. Similarly, the statistical analysis conducted on geographies consisting of 119,265,453 people shows a slight positive correlation between the proportion of Immigrants from Albania and percentage of population with at least 3rd grade education in the United States with a correlation coefficient (R) of 0.088 and weighted average of 97.7%, a difference of 0.52%.
3rd Grade Correlation Summary
| Measurement | Barbadian | Immigrants from Albania |
| Minimum | 94.3% | 94.2% |
| Maximum | 100.0% | 100.0% |
| Range | 5.7% | 5.8% |
| Mean | 97.8% | 98.0% |
| Median | 97.7% | 98.1% |
| Interquartile 25% (IQ1) | 97.0% | 97.4% |
| Interquartile 75% (IQ3) | 98.6% | 98.7% |
| Interquartile Range (IQR) | 1.5% | 1.3% |
| Standard Deviation (Sample) | 1.3% | 1.1% |
| Standard Deviation (Population) | 1.3% | 1.1% |
Similar Demographics by 3rd Grade
Demographics Similar to Barbadians by 3rd Grade
In terms of 3rd grade, the demographic groups most similar to Barbadians are Immigrants from Philippines (97.2%, a difference of 0.010%), Immigrants from Ghana (97.2%, a difference of 0.010%), Afghan (97.1%, a difference of 0.010%), Immigrants from Bolivia (97.2%, a difference of 0.020%), and Trinidadian and Tobagonian (97.2%, a difference of 0.020%).
| Demographics | Rating | Rank | 3rd Grade |
| Immigrants | Cameroon | 0.1 /100 | #274 | Tragic 97.2% |
| Immigrants | Uzbekistan | 0.1 /100 | #275 | Tragic 97.2% |
| Immigrants | Bolivia | 0.1 /100 | #276 | Tragic 97.2% |
| Trinidadians and Tobagonians | 0.1 /100 | #277 | Tragic 97.2% |
| Immigrants | Western Africa | 0.1 /100 | #278 | Tragic 97.2% |
| Immigrants | Philippines | 0.1 /100 | #279 | Tragic 97.2% |
| Immigrants | Ghana | 0.1 /100 | #280 | Tragic 97.2% |
| Barbadians | 0.1 /100 | #281 | Tragic 97.2% |
| Afghans | 0.1 /100 | #282 | Tragic 97.1% |
| Houma | 0.1 /100 | #283 | Tragic 97.1% |
| Immigrants | Trinidad and Tobago | 0.0 /100 | #284 | Tragic 97.1% |
| Immigrants | Hong Kong | 0.0 /100 | #285 | Tragic 97.1% |
| Immigrants | Barbados | 0.0 /100 | #286 | Tragic 97.1% |
| Immigrants | St. Vincent and the Grenadines | 0.0 /100 | #287 | Tragic 97.1% |
| Immigrants | West Indies | 0.0 /100 | #288 | Tragic 97.1% |
Demographics Similar to Immigrants from Albania by 3rd Grade
In terms of 3rd grade, the demographic groups most similar to Immigrants from Albania are Immigrants from Ukraine (97.7%, a difference of 0.0%), Immigrants from Lebanon (97.7%, a difference of 0.0%), Hawaiian (97.7%, a difference of 0.010%), Guamanian/Chamorro (97.7%, a difference of 0.010%), and Immigrants from Uganda (97.7%, a difference of 0.020%).
| Demographics | Rating | Rank | 3rd Grade |
| Immigrants | Kenya | 28.2 /100 | #193 | Fair 97.7% |
| Immigrants | Uganda | 27.4 /100 | #194 | Fair 97.7% |
| Immigrants | Egypt | 26.8 /100 | #195 | Fair 97.7% |
| Paraguayans | 26.2 /100 | #196 | Fair 97.7% |
| Hawaiians | 25.7 /100 | #197 | Fair 97.7% |
| Guamanians/Chamorros | 23.6 /100 | #198 | Fair 97.7% |
| Immigrants | Ukraine | 22.7 /100 | #199 | Fair 97.7% |
| Immigrants | Albania | 22.6 /100 | #200 | Fair 97.7% |
| Immigrants | Lebanon | 21.7 /100 | #201 | Fair 97.7% |
| Immigrants | Southern Europe | 17.7 /100 | #202 | Poor 97.6% |
| Paiute | 16.7 /100 | #203 | Poor 97.6% |
| Immigrants | Chile | 16.5 /100 | #204 | Poor 97.6% |
| Africans | 14.5 /100 | #205 | Poor 97.6% |
| Immigrants | Northern Africa | 13.0 /100 | #206 | Poor 97.6% |
| Tohono O'odham | 12.5 /100 | #207 | Poor 97.6% |