Barbadian vs Yakama 4th Grade
COMPARE
Barbadian
Yakama
4th Grade
4th Grade Comparison
Barbadians
Yakama
96.9%
4TH GRADE
0.1/ 100
METRIC RATING
280th/ 347
METRIC RANK
95.2%
4TH GRADE
0.0/ 100
METRIC RATING
340th/ 347
METRIC RANK
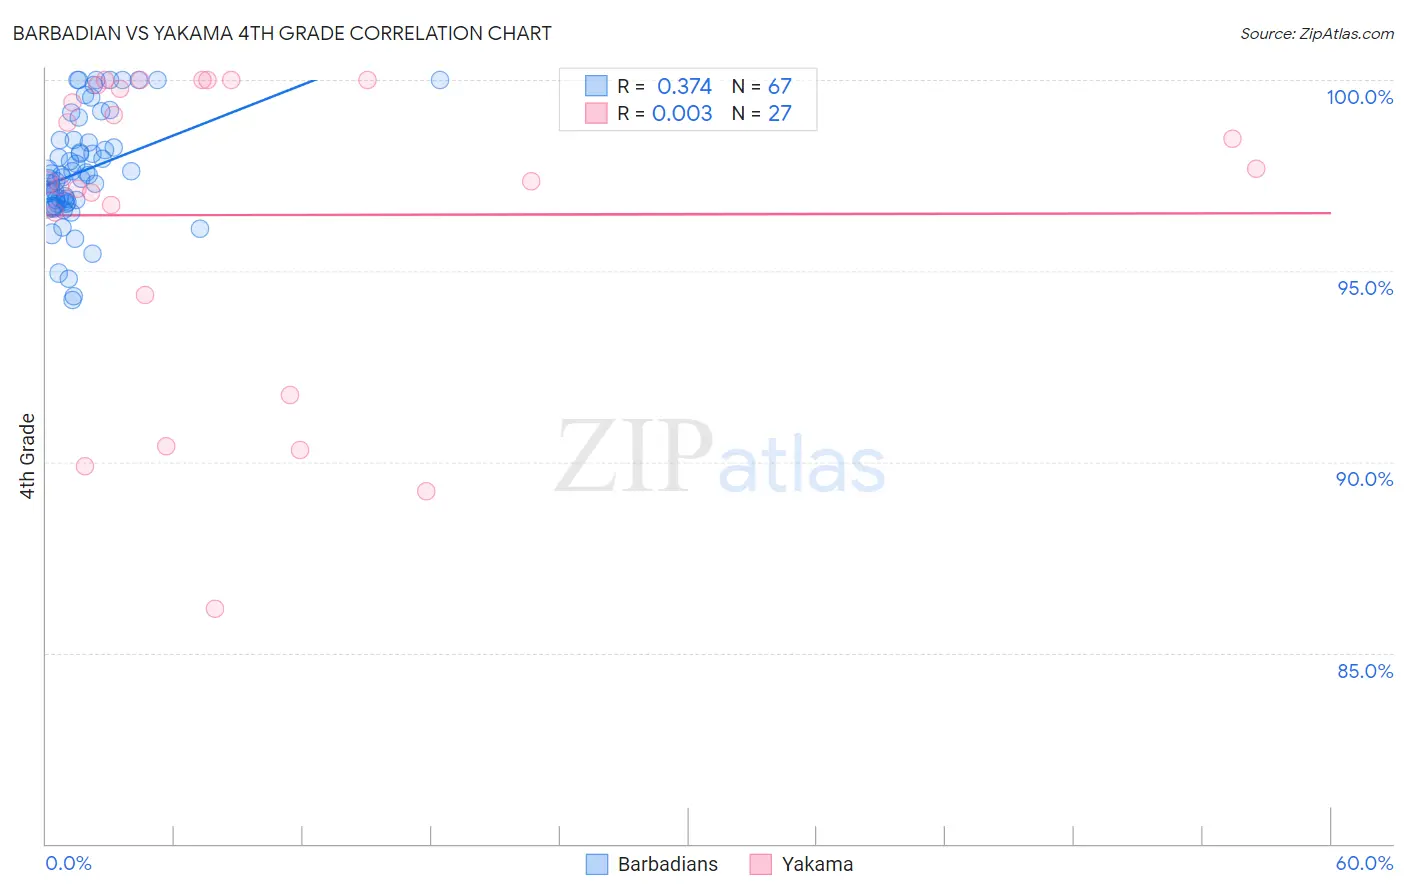
Barbadian vs Yakama 4th Grade Correlation Chart
The statistical analysis conducted on geographies consisting of 141,304,590 people shows a mild positive correlation between the proportion of Barbadians and percentage of population with at least 4th grade education in the United States with a correlation coefficient (R) of 0.374 and weighted average of 96.9%. Similarly, the statistical analysis conducted on geographies consisting of 19,923,144 people shows no correlation between the proportion of Yakama and percentage of population with at least 4th grade education in the United States with a correlation coefficient (R) of 0.003 and weighted average of 95.2%, a difference of 1.8%.
4th Grade Correlation Summary
| Measurement | Barbadian | Yakama |
| Minimum | 94.2% | 86.2% |
| Maximum | 100.0% | 100.0% |
| Range | 5.8% | 13.8% |
| Mean | 97.6% | 96.5% |
| Median | 97.5% | 97.3% |
| Interquartile 25% (IQ1) | 96.8% | 94.4% |
| Interquartile 75% (IQ3) | 98.4% | 99.9% |
| Interquartile Range (IQR) | 1.6% | 5.5% |
| Standard Deviation (Sample) | 1.4% | 4.1% |
| Standard Deviation (Population) | 1.4% | 4.0% |
Similar Demographics by 4th Grade
Demographics Similar to Barbadians by 4th Grade
In terms of 4th grade, the demographic groups most similar to Barbadians are Afghan (96.9%, a difference of 0.010%), Immigrants from Hong Kong (96.9%, a difference of 0.010%), Yaqui (96.9%, a difference of 0.020%), Immigrants from Western Africa (96.9%, a difference of 0.020%), and Immigrants from Bolivia (96.9%, a difference of 0.020%).
| Demographics | Rating | Rank | 4th Grade |
| Immigrants | Cameroon | 0.1 /100 | #273 | Tragic 96.9% |
| Trinidadians and Tobagonians | 0.1 /100 | #274 | Tragic 96.9% |
| Immigrants | Ghana | 0.1 /100 | #275 | Tragic 96.9% |
| Yaqui | 0.1 /100 | #276 | Tragic 96.9% |
| Immigrants | Western Africa | 0.1 /100 | #277 | Tragic 96.9% |
| Immigrants | Bolivia | 0.1 /100 | #278 | Tragic 96.9% |
| Afghans | 0.1 /100 | #279 | Tragic 96.9% |
| Barbadians | 0.1 /100 | #280 | Tragic 96.9% |
| Immigrants | Hong Kong | 0.1 /100 | #281 | Tragic 96.9% |
| Immigrants | Trinidad and Tobago | 0.1 /100 | #282 | Tragic 96.8% |
| Immigrants | Philippines | 0.1 /100 | #283 | Tragic 96.8% |
| Immigrants | St. Vincent and the Grenadines | 0.1 /100 | #284 | Tragic 96.8% |
| Immigrants | Barbados | 0.0 /100 | #285 | Tragic 96.8% |
| Immigrants | Thailand | 0.0 /100 | #286 | Tragic 96.8% |
| Houma | 0.0 /100 | #287 | Tragic 96.8% |
Demographics Similar to Yakama by 4th Grade
In terms of 4th grade, the demographic groups most similar to Yakama are Immigrants from Yemen (95.2%, a difference of 0.010%), Guatemalan (95.3%, a difference of 0.090%), Immigrants from Central America (95.1%, a difference of 0.090%), Immigrants from Guatemala (95.1%, a difference of 0.12%), and Immigrants from Mexico (95.1%, a difference of 0.15%).
| Demographics | Rating | Rank | 4th Grade |
| Immigrants | Dominican Republic | 0.0 /100 | #333 | Tragic 95.7% |
| Immigrants | Cabo Verde | 0.0 /100 | #334 | Tragic 95.7% |
| Immigrants | Latin America | 0.0 /100 | #335 | Tragic 95.7% |
| Mexicans | 0.0 /100 | #336 | Tragic 95.6% |
| Central Americans | 0.0 /100 | #337 | Tragic 95.5% |
| Nepalese | 0.0 /100 | #338 | Tragic 95.5% |
| Guatemalans | 0.0 /100 | #339 | Tragic 95.3% |
| Yakama | 0.0 /100 | #340 | Tragic 95.2% |
| Immigrants | Yemen | 0.0 /100 | #341 | Tragic 95.2% |
| Immigrants | Central America | 0.0 /100 | #342 | Tragic 95.1% |
| Immigrants | Guatemala | 0.0 /100 | #343 | Tragic 95.1% |
| Immigrants | Mexico | 0.0 /100 | #344 | Tragic 95.1% |
| Salvadorans | 0.0 /100 | #345 | Tragic 95.0% |
| Immigrants | El Salvador | 0.0 /100 | #346 | Tragic 94.8% |
| Spanish American Indians | 0.0 /100 | #347 | Tragic 94.6% |