Bahamian vs Immigrants from Portugal Associate's Degree
COMPARE
Bahamian
Immigrants from Portugal
Associate's Degree
Associate's Degree Comparison
Bahamians
Immigrants from Portugal
41.5%
ASSOCIATE'S DEGREE
0.4/ 100
METRIC RATING
262nd/ 347
METRIC RANK
40.1%
ASSOCIATE'S DEGREE
0.1/ 100
METRIC RATING
281st/ 347
METRIC RANK
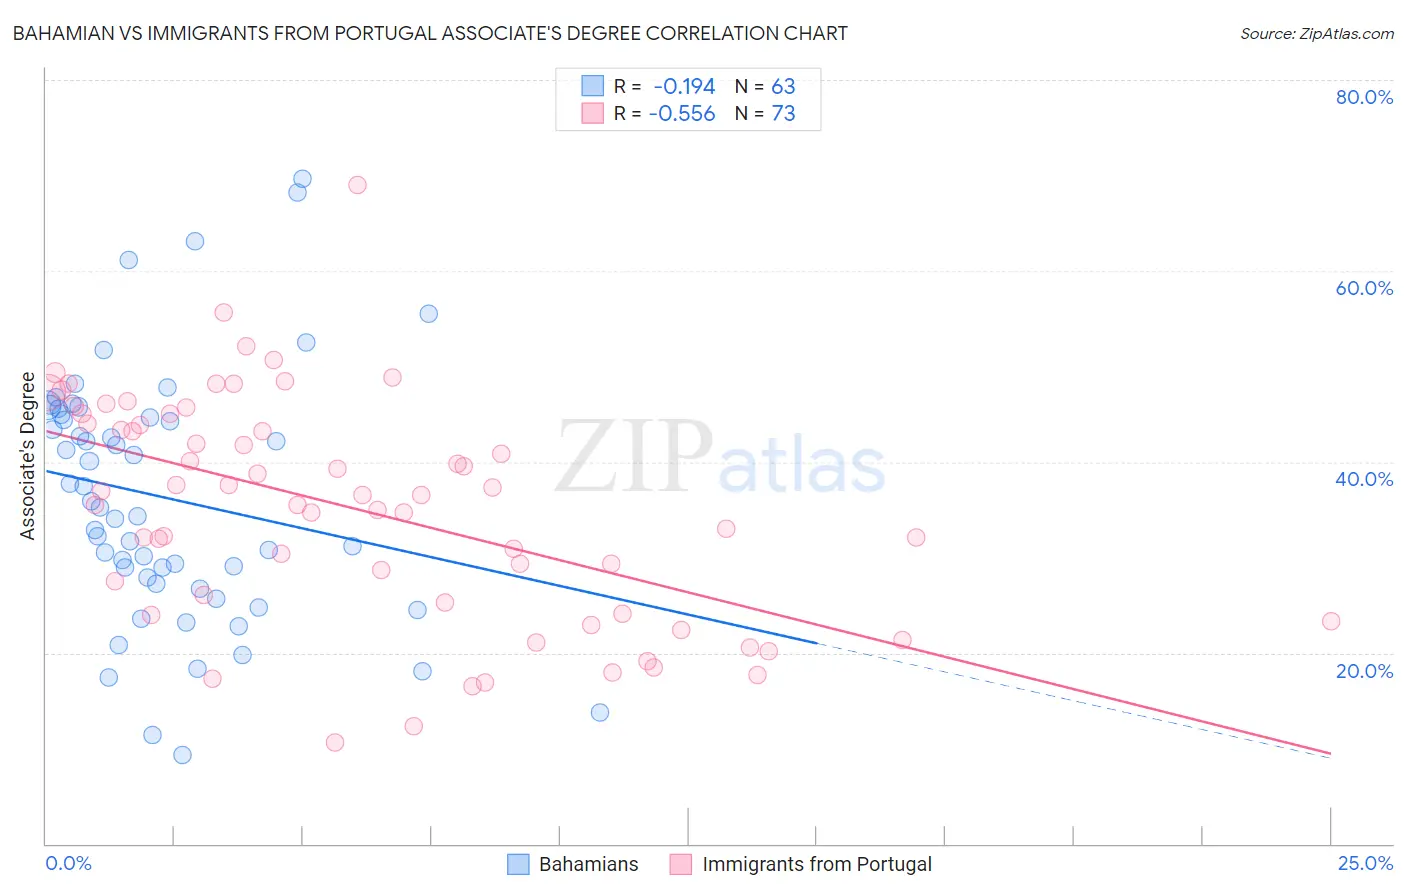
Bahamian vs Immigrants from Portugal Associate's Degree Correlation Chart
The statistical analysis conducted on geographies consisting of 112,704,799 people shows a poor negative correlation between the proportion of Bahamians and percentage of population with at least associate's degree education in the United States with a correlation coefficient (R) of -0.194 and weighted average of 41.5%. Similarly, the statistical analysis conducted on geographies consisting of 174,792,107 people shows a substantial negative correlation between the proportion of Immigrants from Portugal and percentage of population with at least associate's degree education in the United States with a correlation coefficient (R) of -0.556 and weighted average of 40.1%, a difference of 3.3%.
Associate's Degree Correlation Summary
| Measurement | Bahamian | Immigrants from Portugal |
| Minimum | 9.3% | 10.6% |
| Maximum | 69.7% | 69.0% |
| Range | 60.4% | 58.4% |
| Mean | 36.3% | 35.1% |
| Median | 35.2% | 36.6% |
| Interquartile 25% (IQ1) | 27.3% | 24.6% |
| Interquartile 75% (IQ3) | 45.0% | 44.5% |
| Interquartile Range (IQR) | 17.7% | 19.9% |
| Standard Deviation (Sample) | 13.1% | 11.8% |
| Standard Deviation (Population) | 13.0% | 11.7% |
Demographics Similar to Bahamians and Immigrants from Portugal by Associate's Degree
In terms of associate's degree, the demographic groups most similar to Bahamians are Immigrants from Jamaica (41.5%, a difference of 0.020%), Osage (41.5%, a difference of 0.030%), Nicaraguan (41.5%, a difference of 0.090%), African (41.1%, a difference of 0.79%), and Samoan (41.1%, a difference of 0.79%). Similarly, the demographic groups most similar to Immigrants from Portugal are Immigrants from Micronesia (40.2%, a difference of 0.10%), Immigrants from Nicaragua (40.3%, a difference of 0.30%), Ottawa (40.3%, a difference of 0.34%), Blackfeet (40.3%, a difference of 0.49%), and Puerto Rican (40.4%, a difference of 0.54%).
| Demographics | Rating | Rank | Associate's Degree |
| Nicaraguans | 0.4 /100 | #261 | Tragic 41.5% |
| Bahamians | 0.4 /100 | #262 | Tragic 41.5% |
| Immigrants | Jamaica | 0.3 /100 | #263 | Tragic 41.5% |
| Osage | 0.3 /100 | #264 | Tragic 41.5% |
| Africans | 0.2 /100 | #265 | Tragic 41.1% |
| Samoans | 0.2 /100 | #266 | Tragic 41.1% |
| Hawaiians | 0.2 /100 | #267 | Tragic 40.9% |
| Central American Indians | 0.2 /100 | #268 | Tragic 40.8% |
| Americans | 0.2 /100 | #269 | Tragic 40.8% |
| Chippewa | 0.2 /100 | #270 | Tragic 40.7% |
| Immigrants | Laos | 0.1 /100 | #271 | Tragic 40.7% |
| Belizeans | 0.1 /100 | #272 | Tragic 40.6% |
| Puget Sound Salish | 0.1 /100 | #273 | Tragic 40.5% |
| Immigrants | Dominica | 0.1 /100 | #274 | Tragic 40.5% |
| Potawatomi | 0.1 /100 | #275 | Tragic 40.4% |
| Puerto Ricans | 0.1 /100 | #276 | Tragic 40.4% |
| Blackfeet | 0.1 /100 | #277 | Tragic 40.3% |
| Ottawa | 0.1 /100 | #278 | Tragic 40.3% |
| Immigrants | Nicaragua | 0.1 /100 | #279 | Tragic 40.3% |
| Immigrants | Micronesia | 0.1 /100 | #280 | Tragic 40.2% |
| Immigrants | Portugal | 0.1 /100 | #281 | Tragic 40.1% |