Bahamian vs Ugandan Associate's Degree
COMPARE
Bahamian
Ugandan
Associate's Degree
Associate's Degree Comparison
Bahamians
Ugandans
41.5%
ASSOCIATE'S DEGREE
0.4/ 100
METRIC RATING
262nd/ 347
METRIC RANK
48.7%
ASSOCIATE'S DEGREE
93.9/ 100
METRIC RATING
121st/ 347
METRIC RANK
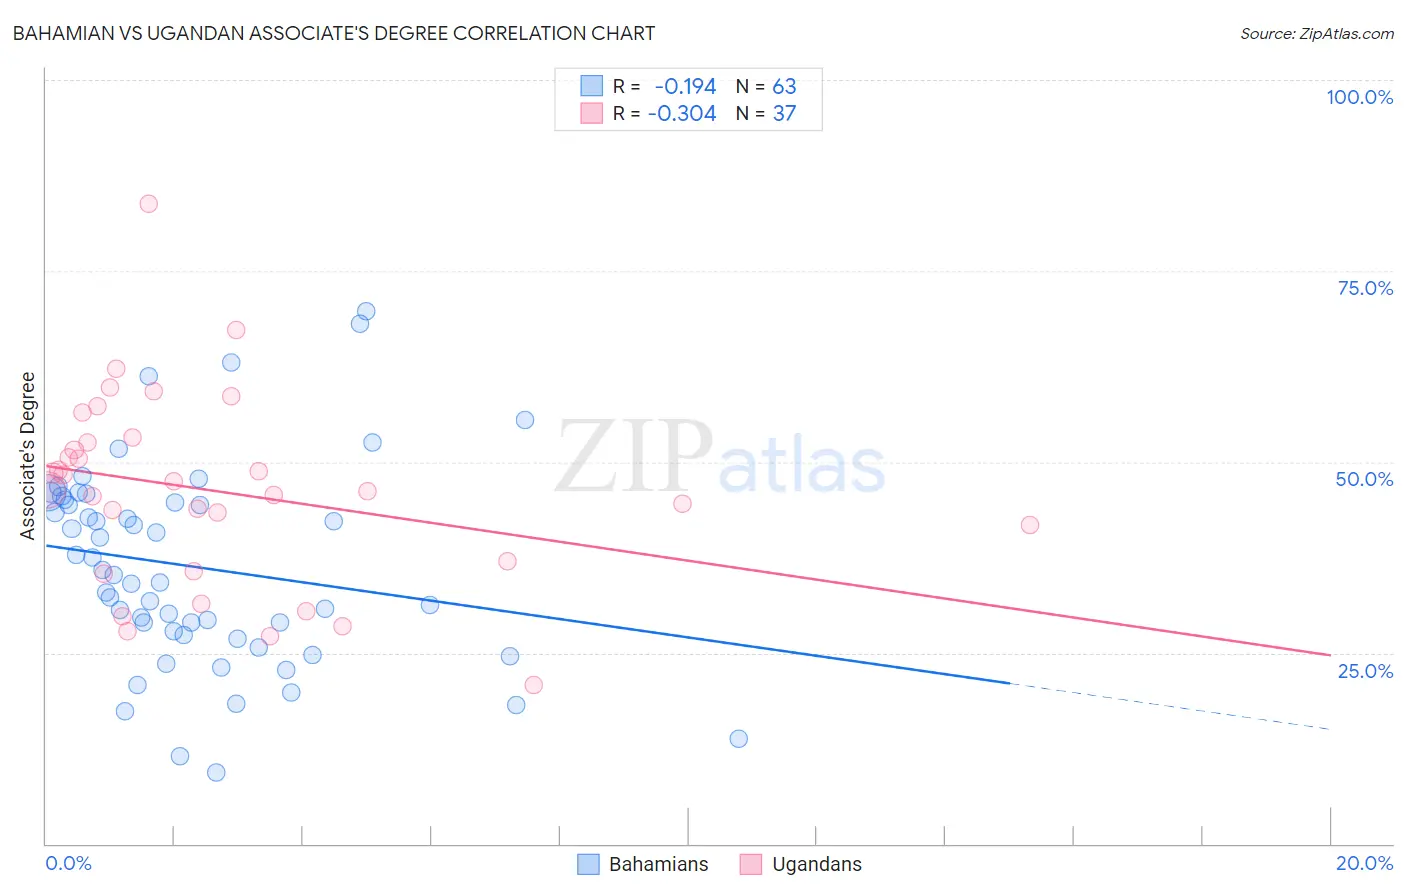
Bahamian vs Ugandan Associate's Degree Correlation Chart
The statistical analysis conducted on geographies consisting of 112,704,799 people shows a poor negative correlation between the proportion of Bahamians and percentage of population with at least associate's degree education in the United States with a correlation coefficient (R) of -0.194 and weighted average of 41.5%. Similarly, the statistical analysis conducted on geographies consisting of 94,018,576 people shows a mild negative correlation between the proportion of Ugandans and percentage of population with at least associate's degree education in the United States with a correlation coefficient (R) of -0.304 and weighted average of 48.7%, a difference of 17.5%.
Associate's Degree Correlation Summary
| Measurement | Bahamian | Ugandan |
| Minimum | 9.3% | 20.8% |
| Maximum | 69.7% | 83.8% |
| Range | 60.4% | 63.0% |
| Mean | 36.3% | 46.2% |
| Median | 35.2% | 46.4% |
| Interquartile 25% (IQ1) | 27.3% | 36.3% |
| Interquartile 75% (IQ3) | 45.0% | 52.8% |
| Interquartile Range (IQR) | 17.7% | 16.5% |
| Standard Deviation (Sample) | 13.1% | 12.7% |
| Standard Deviation (Population) | 13.0% | 12.5% |
Similar Demographics by Associate's Degree
Demographics Similar to Bahamians by Associate's Degree
In terms of associate's degree, the demographic groups most similar to Bahamians are Immigrants from Jamaica (41.5%, a difference of 0.020%), Osage (41.5%, a difference of 0.030%), Nicaraguan (41.5%, a difference of 0.090%), Marshallese (41.6%, a difference of 0.22%), and Malaysian (41.6%, a difference of 0.41%).
| Demographics | Rating | Rank | Associate's Degree |
| Immigrants | Guyana | 0.5 /100 | #255 | Tragic 41.8% |
| Immigrants | Congo | 0.5 /100 | #256 | Tragic 41.8% |
| Spanish Americans | 0.5 /100 | #257 | Tragic 41.8% |
| Japanese | 0.5 /100 | #258 | Tragic 41.7% |
| Malaysians | 0.4 /100 | #259 | Tragic 41.6% |
| Marshallese | 0.4 /100 | #260 | Tragic 41.6% |
| Nicaraguans | 0.4 /100 | #261 | Tragic 41.5% |
| Bahamians | 0.4 /100 | #262 | Tragic 41.5% |
| Immigrants | Jamaica | 0.3 /100 | #263 | Tragic 41.5% |
| Osage | 0.3 /100 | #264 | Tragic 41.5% |
| Africans | 0.2 /100 | #265 | Tragic 41.1% |
| Samoans | 0.2 /100 | #266 | Tragic 41.1% |
| Hawaiians | 0.2 /100 | #267 | Tragic 40.9% |
| Central American Indians | 0.2 /100 | #268 | Tragic 40.8% |
| Americans | 0.2 /100 | #269 | Tragic 40.8% |
Demographics Similar to Ugandans by Associate's Degree
In terms of associate's degree, the demographic groups most similar to Ugandans are Italian (48.7%, a difference of 0.0%), Brazilian (48.7%, a difference of 0.070%), Alsatian (48.8%, a difference of 0.23%), Lebanese (48.8%, a difference of 0.25%), and Albanian (48.8%, a difference of 0.26%).
| Demographics | Rating | Rank | Associate's Degree |
| Arabs | 95.3 /100 | #114 | Exceptional 49.0% |
| Luxembourgers | 95.1 /100 | #115 | Exceptional 48.9% |
| British | 95.0 /100 | #116 | Exceptional 48.9% |
| Afghans | 94.8 /100 | #117 | Exceptional 48.9% |
| Albanians | 94.7 /100 | #118 | Exceptional 48.8% |
| Lebanese | 94.6 /100 | #119 | Exceptional 48.8% |
| Alsatians | 94.6 /100 | #120 | Exceptional 48.8% |
| Ugandans | 93.9 /100 | #121 | Exceptional 48.7% |
| Italians | 93.9 /100 | #122 | Exceptional 48.7% |
| Brazilians | 93.7 /100 | #123 | Exceptional 48.7% |
| Serbians | 92.6 /100 | #124 | Exceptional 48.5% |
| Chinese | 92.5 /100 | #125 | Exceptional 48.5% |
| Immigrants | Syria | 92.2 /100 | #126 | Exceptional 48.5% |
| Immigrants | Uganda | 92.1 /100 | #127 | Exceptional 48.5% |
| Immigrants | Eastern Africa | 91.6 /100 | #128 | Exceptional 48.4% |