Austrian vs Immigrants from Laos 11th Grade
COMPARE
Austrian
Immigrants from Laos
11th Grade
11th Grade Comparison
Austrians
Immigrants from Laos
94.0%
11TH GRADE
99.8/ 100
METRIC RATING
62nd/ 347
METRIC RANK
90.5%
11TH GRADE
0.0/ 100
METRIC RATING
284th/ 347
METRIC RANK
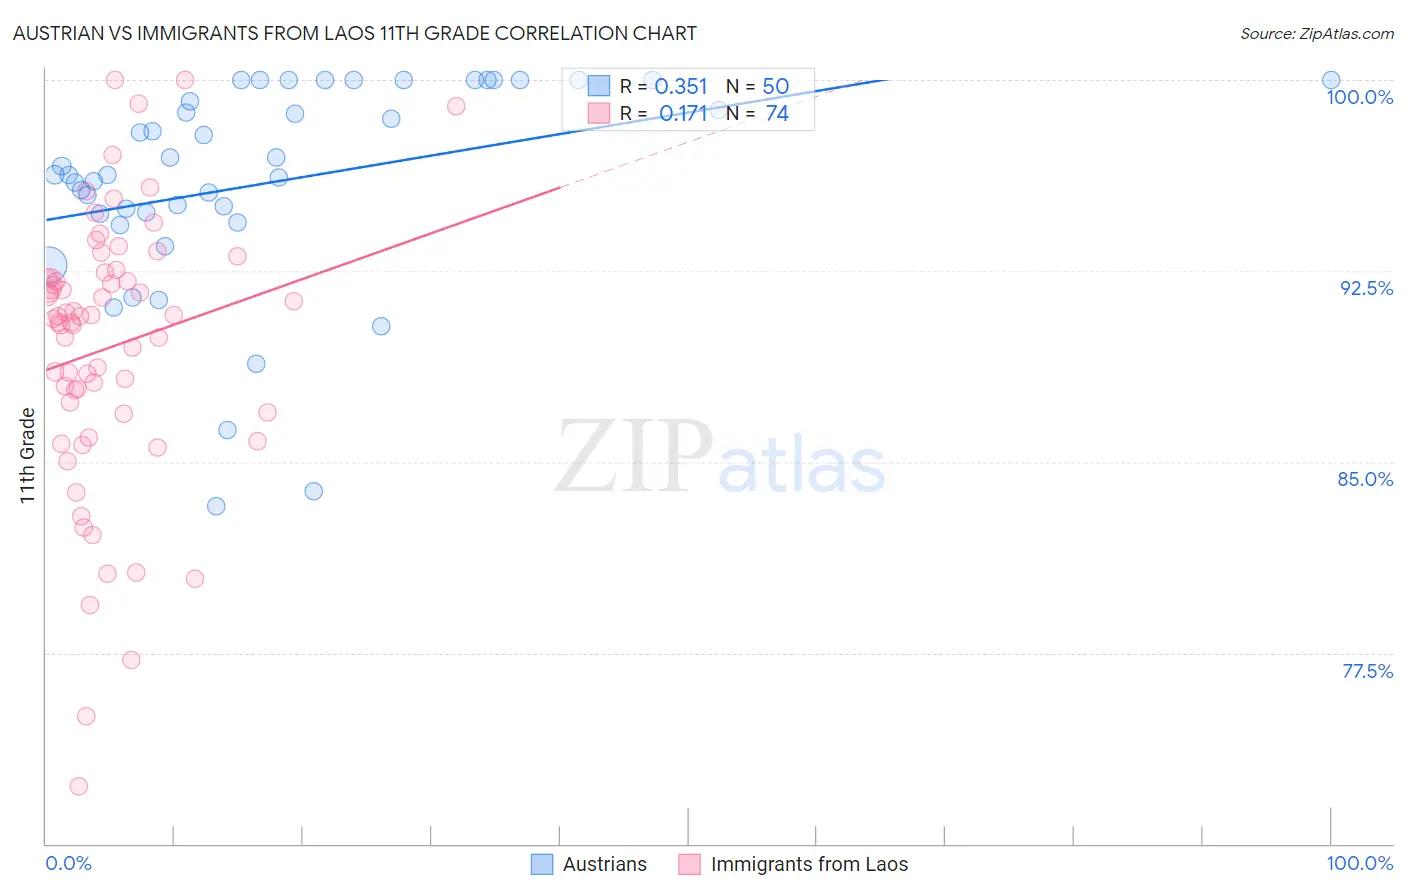
Austrian vs Immigrants from Laos 11th Grade Correlation Chart
The statistical analysis conducted on geographies consisting of 452,082,820 people shows a mild positive correlation between the proportion of Austrians and percentage of population with at least 11th grade education in the United States with a correlation coefficient (R) of 0.351 and weighted average of 94.0%. Similarly, the statistical analysis conducted on geographies consisting of 201,472,886 people shows a poor positive correlation between the proportion of Immigrants from Laos and percentage of population with at least 11th grade education in the United States with a correlation coefficient (R) of 0.171 and weighted average of 90.5%, a difference of 3.8%.
11th Grade Correlation Summary
| Measurement | Austrian | Immigrants from Laos |
| Minimum | 83.3% | 72.3% |
| Maximum | 100.0% | 100.0% |
| Range | 16.7% | 27.7% |
| Mean | 96.0% | 89.5% |
| Median | 96.3% | 90.7% |
| Interquartile 25% (IQ1) | 94.7% | 86.9% |
| Interquartile 75% (IQ3) | 100.0% | 92.3% |
| Interquartile Range (IQR) | 5.3% | 5.3% |
| Standard Deviation (Sample) | 4.1% | 5.4% |
| Standard Deviation (Population) | 4.1% | 5.4% |
Similar Demographics by 11th Grade
Demographics Similar to Austrians by 11th Grade
In terms of 11th grade, the demographic groups most similar to Austrians are Immigrants from Belgium (94.0%, a difference of 0.0%), French Canadian (94.0%, a difference of 0.010%), New Zealander (94.0%, a difference of 0.010%), Iranian (94.0%, a difference of 0.010%), and Bhutanese (94.0%, a difference of 0.010%).
| Demographics | Rating | Rank | 11th Grade |
| Czechoslovakians | 99.9 /100 | #55 | Exceptional 94.0% |
| French Canadians | 99.9 /100 | #56 | Exceptional 94.0% |
| New Zealanders | 99.9 /100 | #57 | Exceptional 94.0% |
| Iranians | 99.9 /100 | #58 | Exceptional 94.0% |
| Bhutanese | 99.8 /100 | #59 | Exceptional 94.0% |
| Okinawans | 99.8 /100 | #60 | Exceptional 94.0% |
| Immigrants | Belgium | 99.8 /100 | #61 | Exceptional 94.0% |
| Austrians | 99.8 /100 | #62 | Exceptional 94.0% |
| Ukrainians | 99.8 /100 | #63 | Exceptional 94.0% |
| Immigrants | Sweden | 99.8 /100 | #64 | Exceptional 93.9% |
| Native Hawaiians | 99.8 /100 | #65 | Exceptional 93.9% |
| Alaskan Athabascans | 99.8 /100 | #66 | Exceptional 93.9% |
| Immigrants | Netherlands | 99.8 /100 | #67 | Exceptional 93.9% |
| Zimbabweans | 99.8 /100 | #68 | Exceptional 93.9% |
| Scotch-Irish | 99.8 /100 | #69 | Exceptional 93.9% |
Demographics Similar to Immigrants from Laos by 11th Grade
In terms of 11th grade, the demographic groups most similar to Immigrants from Laos are Immigrants from Burma/Myanmar (90.4%, a difference of 0.090%), Immigrants from West Indies (90.4%, a difference of 0.14%), Apache (90.4%, a difference of 0.15%), Immigrants from Barbados (90.7%, a difference of 0.17%), and Pennsylvania German (90.3%, a difference of 0.17%).
| Demographics | Rating | Rank | 11th Grade |
| Immigrants | Congo | 0.1 /100 | #277 | Tragic 90.9% |
| Malaysians | 0.1 /100 | #278 | Tragic 90.8% |
| Barbadians | 0.0 /100 | #279 | Tragic 90.8% |
| Sri Lankans | 0.0 /100 | #280 | Tragic 90.7% |
| Dutch West Indians | 0.0 /100 | #281 | Tragic 90.7% |
| Immigrants | St. Vincent and the Grenadines | 0.0 /100 | #282 | Tragic 90.7% |
| Immigrants | Barbados | 0.0 /100 | #283 | Tragic 90.7% |
| Immigrants | Laos | 0.0 /100 | #284 | Tragic 90.5% |
| Immigrants | Burma/Myanmar | 0.0 /100 | #285 | Tragic 90.4% |
| Immigrants | West Indies | 0.0 /100 | #286 | Tragic 90.4% |
| Apache | 0.0 /100 | #287 | Tragic 90.4% |
| Pennsylvania Germans | 0.0 /100 | #288 | Tragic 90.3% |
| British West Indians | 0.0 /100 | #289 | Tragic 90.3% |
| Indonesians | 0.0 /100 | #290 | Tragic 90.3% |
| Haitians | 0.0 /100 | #291 | Tragic 90.3% |