Cypriot vs West Indian 11th Grade
COMPARE
Cypriot
West Indian
11th Grade
11th Grade Comparison
Cypriots
West Indians
94.1%
11TH GRADE
99.9/ 100
METRIC RATING
41st/ 347
METRIC RANK
91.0%
11TH GRADE
0.1/ 100
METRIC RATING
272nd/ 347
METRIC RANK
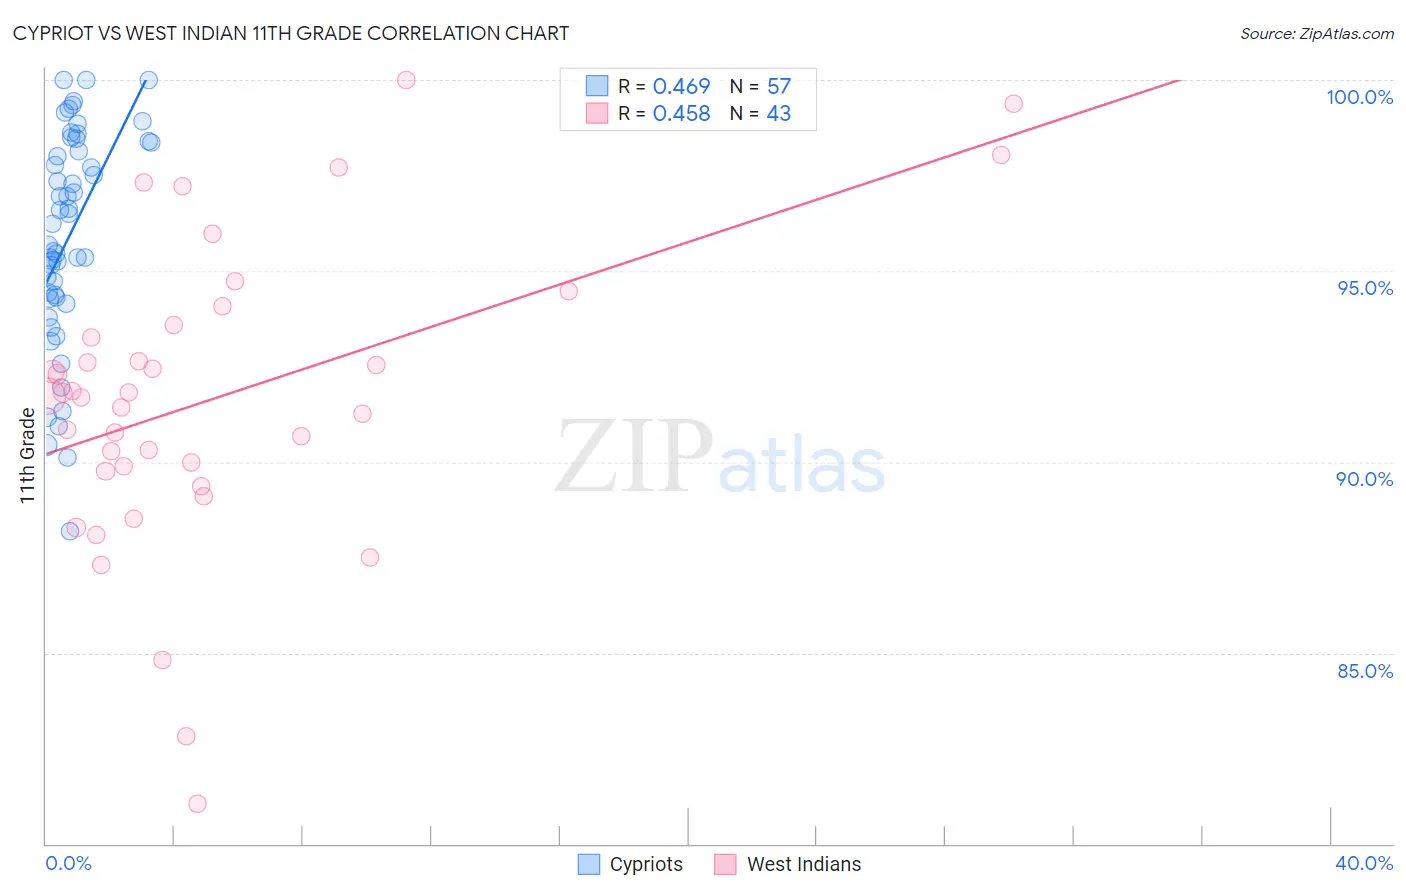
Cypriot vs West Indian 11th Grade Correlation Chart
The statistical analysis conducted on geographies consisting of 61,870,289 people shows a moderate positive correlation between the proportion of Cypriots and percentage of population with at least 11th grade education in the United States with a correlation coefficient (R) of 0.469 and weighted average of 94.1%. Similarly, the statistical analysis conducted on geographies consisting of 254,059,006 people shows a moderate positive correlation between the proportion of West Indians and percentage of population with at least 11th grade education in the United States with a correlation coefficient (R) of 0.458 and weighted average of 91.0%, a difference of 3.4%.
11th Grade Correlation Summary
| Measurement | Cypriot | West Indian |
| Minimum | 88.2% | 81.1% |
| Maximum | 100.0% | 100.0% |
| Range | 11.8% | 18.9% |
| Mean | 95.9% | 91.7% |
| Median | 96.2% | 91.7% |
| Interquartile 25% (IQ1) | 94.3% | 89.7% |
| Interquartile 75% (IQ3) | 98.4% | 93.6% |
| Interquartile Range (IQR) | 4.1% | 3.8% |
| Standard Deviation (Sample) | 2.8% | 4.0% |
| Standard Deviation (Population) | 2.8% | 3.9% |
Similar Demographics by 11th Grade
Demographics Similar to Cypriots by 11th Grade
In terms of 11th grade, the demographic groups most similar to Cypriots are Immigrants from Lithuania (94.1%, a difference of 0.010%), Thai (94.1%, a difference of 0.010%), Immigrants from Austria (94.1%, a difference of 0.010%), Greek (94.1%, a difference of 0.010%), and Immigrants from Ireland (94.1%, a difference of 0.020%).
| Demographics | Rating | Rank | 11th Grade |
| Immigrants | Scotland | 99.9 /100 | #34 | Exceptional 94.2% |
| Immigrants | Singapore | 99.9 /100 | #35 | Exceptional 94.2% |
| Immigrants | Northern Europe | 99.9 /100 | #36 | Exceptional 94.2% |
| Northern Europeans | 99.9 /100 | #37 | Exceptional 94.2% |
| Hungarians | 99.9 /100 | #38 | Exceptional 94.2% |
| Immigrants | Lithuania | 99.9 /100 | #39 | Exceptional 94.1% |
| Thais | 99.9 /100 | #40 | Exceptional 94.1% |
| Cypriots | 99.9 /100 | #41 | Exceptional 94.1% |
| Immigrants | Austria | 99.9 /100 | #42 | Exceptional 94.1% |
| Greeks | 99.9 /100 | #43 | Exceptional 94.1% |
| Immigrants | Ireland | 99.9 /100 | #44 | Exceptional 94.1% |
| Australians | 99.9 /100 | #45 | Exceptional 94.1% |
| Serbians | 99.9 /100 | #46 | Exceptional 94.1% |
| Filipinos | 99.9 /100 | #47 | Exceptional 94.1% |
| Macedonians | 99.9 /100 | #48 | Exceptional 94.1% |
Demographics Similar to West Indians by 11th Grade
In terms of 11th grade, the demographic groups most similar to West Indians are Immigrants from Peru (91.0%, a difference of 0.0%), Trinidadian and Tobagonian (91.1%, a difference of 0.040%), Paiute (91.0%, a difference of 0.050%), Ute (91.1%, a difference of 0.060%), and U.S. Virgin Islander (91.1%, a difference of 0.090%).
| Demographics | Rating | Rank | 11th Grade |
| Pueblo | 0.3 /100 | #265 | Tragic 91.2% |
| Immigrants | Western Africa | 0.3 /100 | #266 | Tragic 91.2% |
| Immigrants | Jamaica | 0.3 /100 | #267 | Tragic 91.2% |
| U.S. Virgin Islanders | 0.2 /100 | #268 | Tragic 91.1% |
| Ute | 0.2 /100 | #269 | Tragic 91.1% |
| Trinidadians and Tobagonians | 0.2 /100 | #270 | Tragic 91.1% |
| Immigrants | Peru | 0.1 /100 | #271 | Tragic 91.0% |
| West Indians | 0.1 /100 | #272 | Tragic 91.0% |
| Paiute | 0.1 /100 | #273 | Tragic 91.0% |
| Immigrants | Trinidad and Tobago | 0.1 /100 | #274 | Tragic 90.9% |
| Immigrants | South Eastern Asia | 0.1 /100 | #275 | Tragic 90.9% |
| Bangladeshis | 0.1 /100 | #276 | Tragic 90.9% |
| Immigrants | Congo | 0.1 /100 | #277 | Tragic 90.9% |
| Malaysians | 0.1 /100 | #278 | Tragic 90.8% |
| Barbadians | 0.0 /100 | #279 | Tragic 90.8% |