Austrian vs Welsh 11th Grade
COMPARE
Austrian
Welsh
11th Grade
11th Grade Comparison
Austrians
Welsh
94.0%
11TH GRADE
99.8/ 100
METRIC RATING
62nd/ 347
METRIC RANK
94.2%
11TH GRADE
99.9/ 100
METRIC RATING
31st/ 347
METRIC RANK
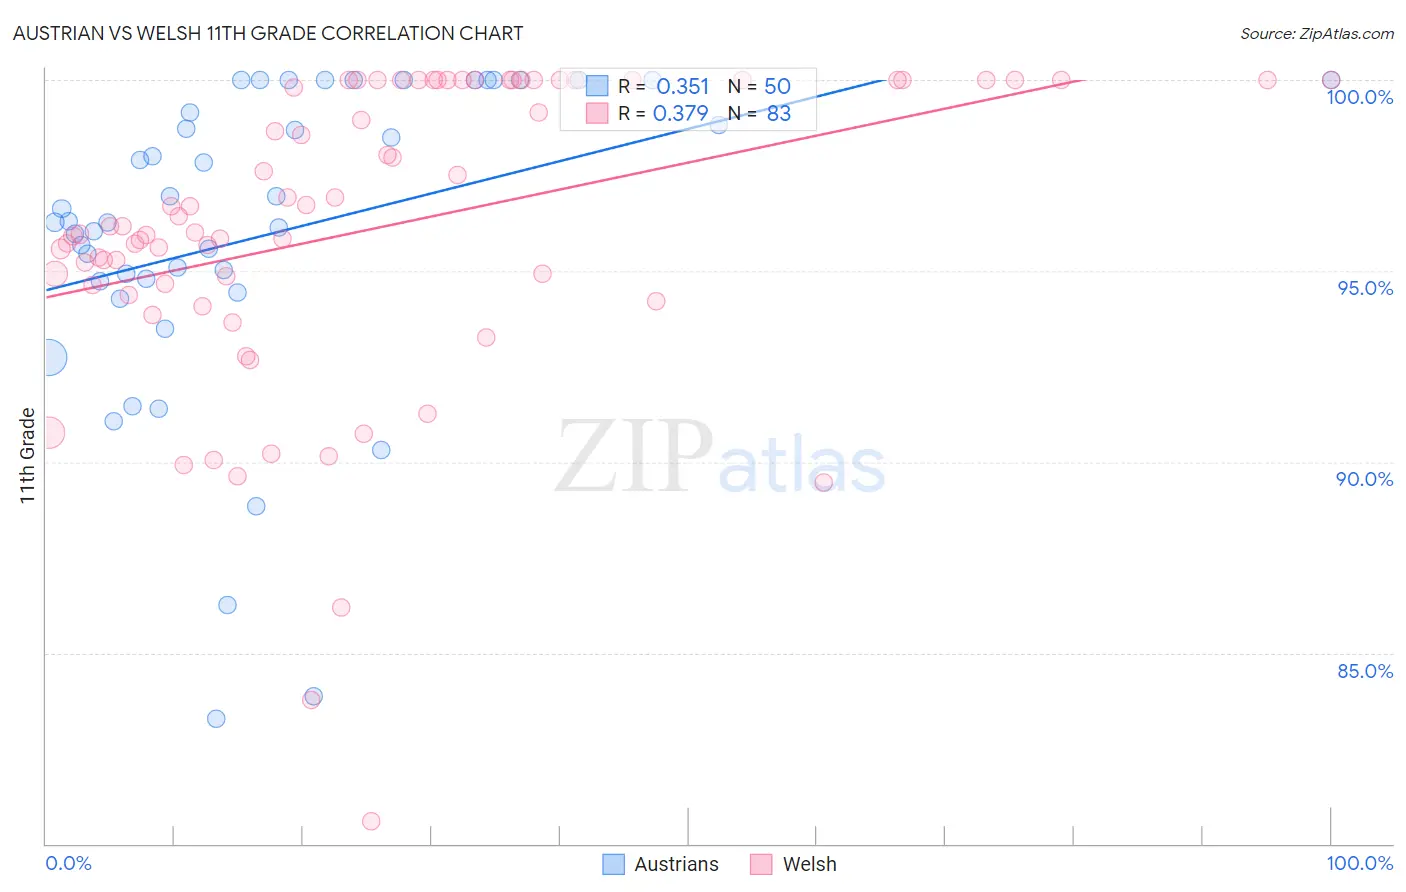
Austrian vs Welsh 11th Grade Correlation Chart
The statistical analysis conducted on geographies consisting of 452,082,820 people shows a mild positive correlation between the proportion of Austrians and percentage of population with at least 11th grade education in the United States with a correlation coefficient (R) of 0.351 and weighted average of 94.0%. Similarly, the statistical analysis conducted on geographies consisting of 528,596,196 people shows a mild positive correlation between the proportion of Welsh and percentage of population with at least 11th grade education in the United States with a correlation coefficient (R) of 0.379 and weighted average of 94.2%, a difference of 0.28%.
11th Grade Correlation Summary
| Measurement | Austrian | Welsh |
| Minimum | 83.3% | 80.6% |
| Maximum | 100.0% | 100.0% |
| Range | 16.7% | 19.4% |
| Mean | 96.0% | 96.1% |
| Median | 96.3% | 96.2% |
| Interquartile 25% (IQ1) | 94.7% | 94.6% |
| Interquartile 75% (IQ3) | 100.0% | 100.0% |
| Interquartile Range (IQR) | 5.3% | 5.4% |
| Standard Deviation (Sample) | 4.1% | 4.0% |
| Standard Deviation (Population) | 4.1% | 4.0% |
Similar Demographics by 11th Grade
Demographics Similar to Austrians by 11th Grade
In terms of 11th grade, the demographic groups most similar to Austrians are Immigrants from Belgium (94.0%, a difference of 0.0%), French Canadian (94.0%, a difference of 0.010%), New Zealander (94.0%, a difference of 0.010%), Iranian (94.0%, a difference of 0.010%), and Bhutanese (94.0%, a difference of 0.010%).
| Demographics | Rating | Rank | 11th Grade |
| Czechoslovakians | 99.9 /100 | #55 | Exceptional 94.0% |
| French Canadians | 99.9 /100 | #56 | Exceptional 94.0% |
| New Zealanders | 99.9 /100 | #57 | Exceptional 94.0% |
| Iranians | 99.9 /100 | #58 | Exceptional 94.0% |
| Bhutanese | 99.8 /100 | #59 | Exceptional 94.0% |
| Okinawans | 99.8 /100 | #60 | Exceptional 94.0% |
| Immigrants | Belgium | 99.8 /100 | #61 | Exceptional 94.0% |
| Austrians | 99.8 /100 | #62 | Exceptional 94.0% |
| Ukrainians | 99.8 /100 | #63 | Exceptional 94.0% |
| Immigrants | Sweden | 99.8 /100 | #64 | Exceptional 93.9% |
| Native Hawaiians | 99.8 /100 | #65 | Exceptional 93.9% |
| Alaskan Athabascans | 99.8 /100 | #66 | Exceptional 93.9% |
| Immigrants | Netherlands | 99.8 /100 | #67 | Exceptional 93.9% |
| Zimbabweans | 99.8 /100 | #68 | Exceptional 93.9% |
| Scotch-Irish | 99.8 /100 | #69 | Exceptional 93.9% |
Demographics Similar to Welsh by 11th Grade
In terms of 11th grade, the demographic groups most similar to Welsh are Belgian (94.2%, a difference of 0.0%), Russian (94.3%, a difference of 0.020%), British (94.2%, a difference of 0.040%), Immigrants from Scotland (94.2%, a difference of 0.040%), and Immigrants from Singapore (94.2%, a difference of 0.050%).
| Demographics | Rating | Rank | 11th Grade |
| English | 100.0 /100 | #24 | Exceptional 94.4% |
| Irish | 100.0 /100 | #25 | Exceptional 94.4% |
| Scottish | 100.0 /100 | #26 | Exceptional 94.4% |
| Europeans | 100.0 /100 | #27 | Exceptional 94.4% |
| Estonians | 100.0 /100 | #28 | Exceptional 94.4% |
| Dutch | 100.0 /100 | #29 | Exceptional 94.3% |
| Russians | 100.0 /100 | #30 | Exceptional 94.3% |
| Welsh | 99.9 /100 | #31 | Exceptional 94.2% |
| Belgians | 99.9 /100 | #32 | Exceptional 94.2% |
| British | 99.9 /100 | #33 | Exceptional 94.2% |
| Immigrants | Scotland | 99.9 /100 | #34 | Exceptional 94.2% |
| Immigrants | Singapore | 99.9 /100 | #35 | Exceptional 94.2% |
| Immigrants | Northern Europe | 99.9 /100 | #36 | Exceptional 94.2% |
| Northern Europeans | 99.9 /100 | #37 | Exceptional 94.2% |
| Hungarians | 99.9 /100 | #38 | Exceptional 94.2% |