Austrian vs African 11th Grade
COMPARE
Austrian
African
11th Grade
11th Grade Comparison
Austrians
Africans
94.0%
11TH GRADE
99.8/ 100
METRIC RATING
62nd/ 347
METRIC RANK
91.5%
11TH GRADE
1.3/ 100
METRIC RATING
245th/ 347
METRIC RANK
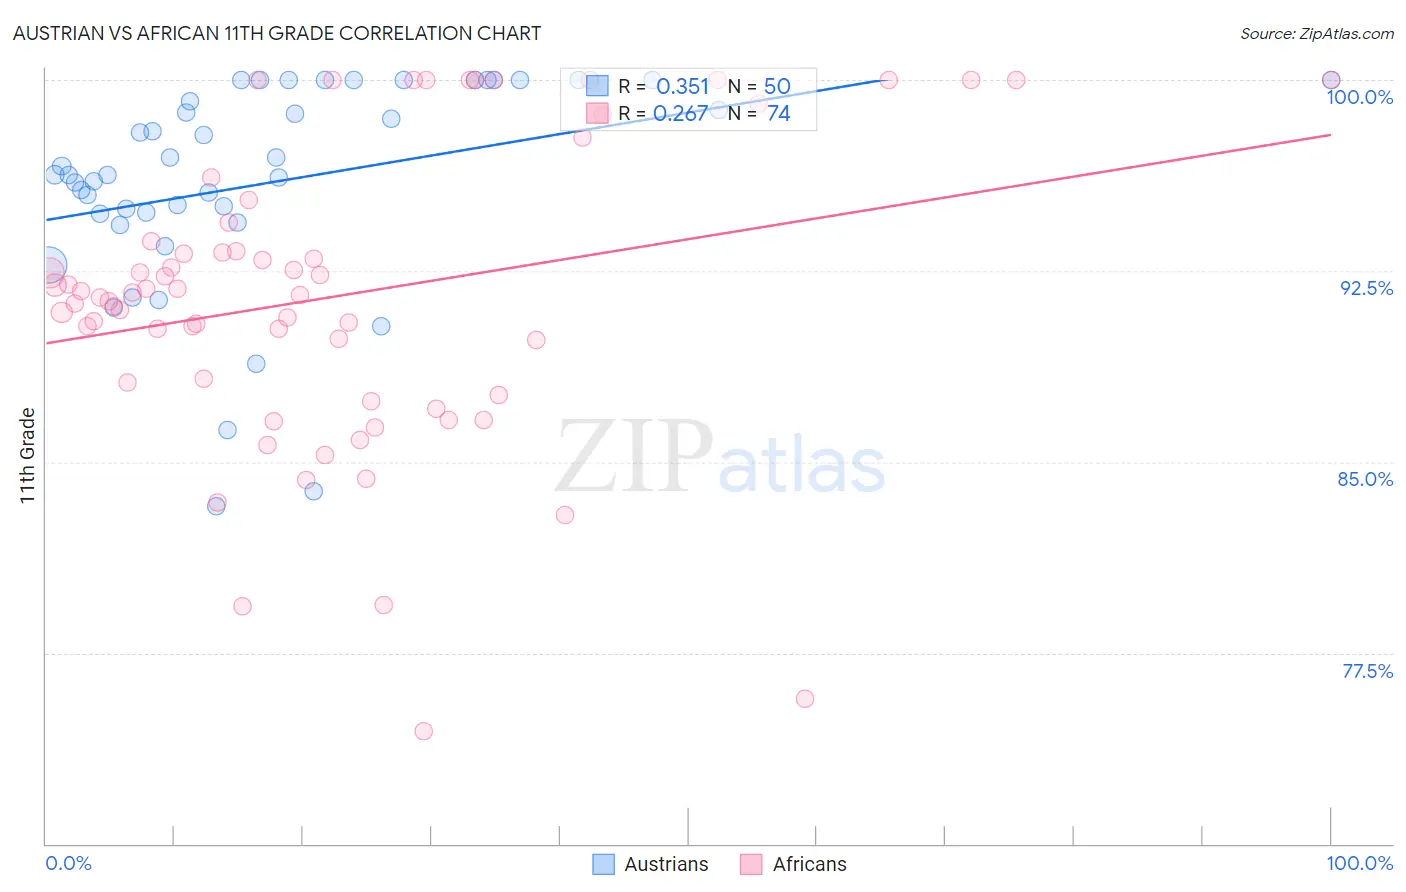
Austrian vs African 11th Grade Correlation Chart
The statistical analysis conducted on geographies consisting of 452,082,820 people shows a mild positive correlation between the proportion of Austrians and percentage of population with at least 11th grade education in the United States with a correlation coefficient (R) of 0.351 and weighted average of 94.0%. Similarly, the statistical analysis conducted on geographies consisting of 470,094,658 people shows a weak positive correlation between the proportion of Africans and percentage of population with at least 11th grade education in the United States with a correlation coefficient (R) of 0.267 and weighted average of 91.5%, a difference of 2.7%.
11th Grade Correlation Summary
| Measurement | Austrian | African |
| Minimum | 83.3% | 74.4% |
| Maximum | 100.0% | 100.0% |
| Range | 16.7% | 25.6% |
| Mean | 96.0% | 91.5% |
| Median | 96.3% | 91.6% |
| Interquartile 25% (IQ1) | 94.7% | 88.1% |
| Interquartile 75% (IQ3) | 100.0% | 94.4% |
| Interquartile Range (IQR) | 5.3% | 6.3% |
| Standard Deviation (Sample) | 4.1% | 5.9% |
| Standard Deviation (Population) | 4.1% | 5.8% |
Similar Demographics by 11th Grade
Demographics Similar to Austrians by 11th Grade
In terms of 11th grade, the demographic groups most similar to Austrians are Immigrants from Belgium (94.0%, a difference of 0.0%), French Canadian (94.0%, a difference of 0.010%), New Zealander (94.0%, a difference of 0.010%), Iranian (94.0%, a difference of 0.010%), and Bhutanese (94.0%, a difference of 0.010%).
| Demographics | Rating | Rank | 11th Grade |
| Czechoslovakians | 99.9 /100 | #55 | Exceptional 94.0% |
| French Canadians | 99.9 /100 | #56 | Exceptional 94.0% |
| New Zealanders | 99.9 /100 | #57 | Exceptional 94.0% |
| Iranians | 99.9 /100 | #58 | Exceptional 94.0% |
| Bhutanese | 99.8 /100 | #59 | Exceptional 94.0% |
| Okinawans | 99.8 /100 | #60 | Exceptional 94.0% |
| Immigrants | Belgium | 99.8 /100 | #61 | Exceptional 94.0% |
| Austrians | 99.8 /100 | #62 | Exceptional 94.0% |
| Ukrainians | 99.8 /100 | #63 | Exceptional 94.0% |
| Immigrants | Sweden | 99.8 /100 | #64 | Exceptional 93.9% |
| Native Hawaiians | 99.8 /100 | #65 | Exceptional 93.9% |
| Alaskan Athabascans | 99.8 /100 | #66 | Exceptional 93.9% |
| Immigrants | Netherlands | 99.8 /100 | #67 | Exceptional 93.9% |
| Zimbabweans | 99.8 /100 | #68 | Exceptional 93.9% |
| Scotch-Irish | 99.8 /100 | #69 | Exceptional 93.9% |
Demographics Similar to Africans by 11th Grade
In terms of 11th grade, the demographic groups most similar to Africans are Senegalese (91.6%, a difference of 0.010%), Immigrants from Thailand (91.6%, a difference of 0.020%), Seminole (91.5%, a difference of 0.030%), Immigrants from Middle Africa (91.6%, a difference of 0.050%), and Immigrants from Philippines (91.5%, a difference of 0.070%).
| Demographics | Rating | Rank | 11th Grade |
| Comanche | 2.6 /100 | #238 | Tragic 91.7% |
| Hopi | 2.5 /100 | #239 | Tragic 91.7% |
| South Americans | 2.0 /100 | #240 | Tragic 91.6% |
| Bahamians | 1.8 /100 | #241 | Tragic 91.6% |
| Immigrants | Middle Africa | 1.6 /100 | #242 | Tragic 91.6% |
| Immigrants | Thailand | 1.4 /100 | #243 | Tragic 91.6% |
| Senegalese | 1.4 /100 | #244 | Tragic 91.6% |
| Africans | 1.3 /100 | #245 | Tragic 91.5% |
| Seminole | 1.2 /100 | #246 | Tragic 91.5% |
| Immigrants | Philippines | 1.0 /100 | #247 | Tragic 91.5% |
| Immigrants | Uzbekistan | 1.0 /100 | #248 | Tragic 91.5% |
| Peruvians | 1.0 /100 | #249 | Tragic 91.5% |
| Ghanaians | 0.9 /100 | #250 | Tragic 91.5% |
| Immigrants | Costa Rica | 0.9 /100 | #251 | Tragic 91.4% |
| Immigrants | Nigeria | 0.8 /100 | #252 | Tragic 91.4% |