Austrian vs Immigrants from Sierra Leone 11th Grade
COMPARE
Austrian
Immigrants from Sierra Leone
11th Grade
11th Grade Comparison
Austrians
Immigrants from Sierra Leone
94.0%
11TH GRADE
99.8/ 100
METRIC RATING
62nd/ 347
METRIC RANK
92.0%
11TH GRADE
11.1/ 100
METRIC RATING
217th/ 347
METRIC RANK
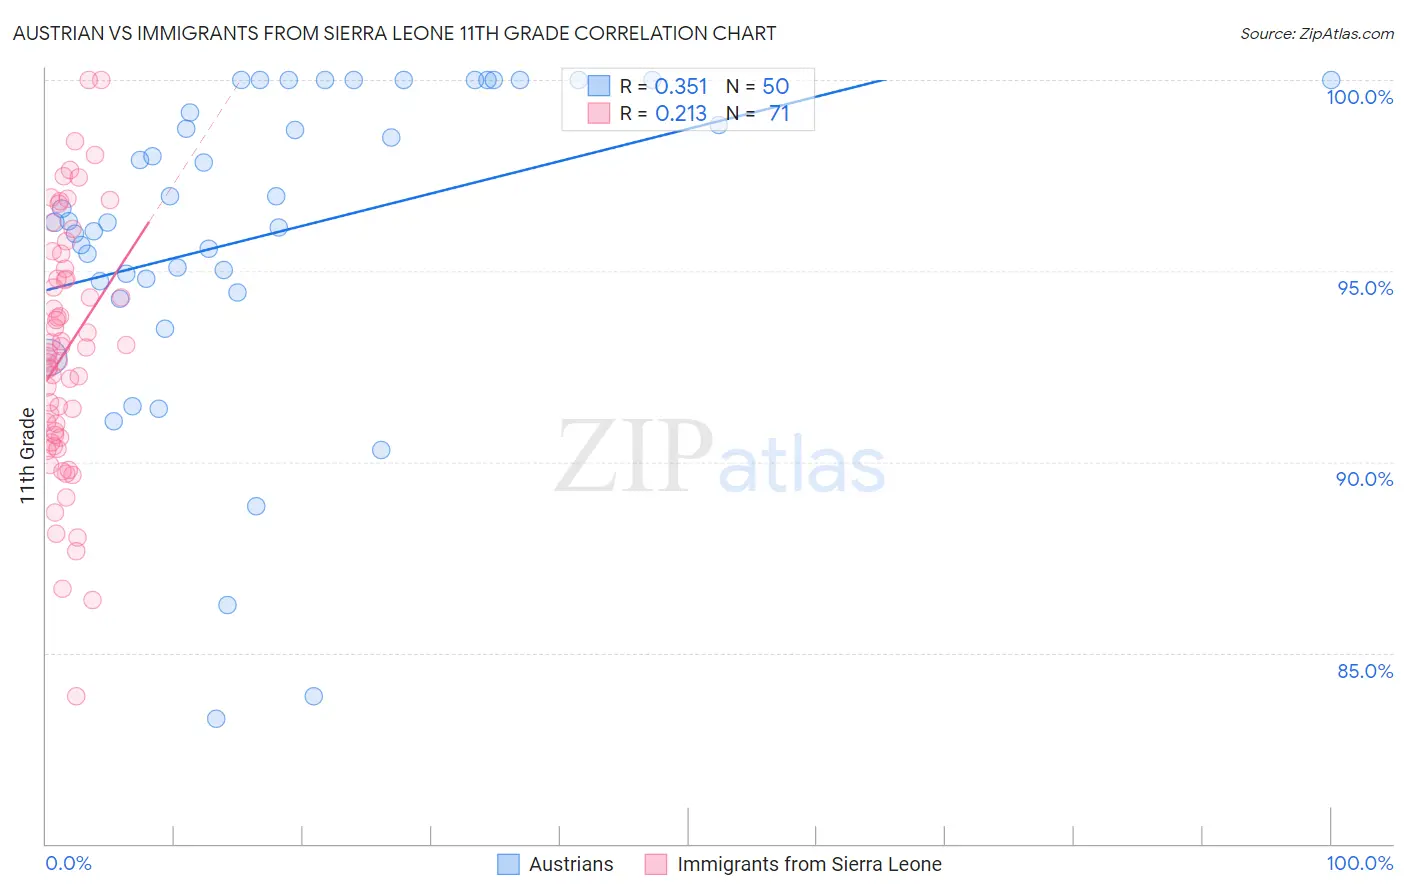
Austrian vs Immigrants from Sierra Leone 11th Grade Correlation Chart
The statistical analysis conducted on geographies consisting of 452,082,820 people shows a mild positive correlation between the proportion of Austrians and percentage of population with at least 11th grade education in the United States with a correlation coefficient (R) of 0.351 and weighted average of 94.0%. Similarly, the statistical analysis conducted on geographies consisting of 101,654,421 people shows a weak positive correlation between the proportion of Immigrants from Sierra Leone and percentage of population with at least 11th grade education in the United States with a correlation coefficient (R) of 0.213 and weighted average of 92.0%, a difference of 2.1%.
11th Grade Correlation Summary
| Measurement | Austrian | Immigrants from Sierra Leone |
| Minimum | 83.3% | 83.9% |
| Maximum | 100.0% | 100.0% |
| Range | 16.7% | 16.1% |
| Mean | 96.0% | 92.9% |
| Median | 96.3% | 92.9% |
| Interquartile 25% (IQ1) | 94.7% | 90.6% |
| Interquartile 75% (IQ3) | 100.0% | 95.0% |
| Interquartile Range (IQR) | 5.3% | 4.4% |
| Standard Deviation (Sample) | 4.1% | 3.3% |
| Standard Deviation (Population) | 4.1% | 3.2% |
Similar Demographics by 11th Grade
Demographics Similar to Austrians by 11th Grade
In terms of 11th grade, the demographic groups most similar to Austrians are Immigrants from Belgium (94.0%, a difference of 0.0%), French Canadian (94.0%, a difference of 0.010%), New Zealander (94.0%, a difference of 0.010%), Iranian (94.0%, a difference of 0.010%), and Bhutanese (94.0%, a difference of 0.010%).
| Demographics | Rating | Rank | 11th Grade |
| Czechoslovakians | 99.9 /100 | #55 | Exceptional 94.0% |
| French Canadians | 99.9 /100 | #56 | Exceptional 94.0% |
| New Zealanders | 99.9 /100 | #57 | Exceptional 94.0% |
| Iranians | 99.9 /100 | #58 | Exceptional 94.0% |
| Bhutanese | 99.8 /100 | #59 | Exceptional 94.0% |
| Okinawans | 99.8 /100 | #60 | Exceptional 94.0% |
| Immigrants | Belgium | 99.8 /100 | #61 | Exceptional 94.0% |
| Austrians | 99.8 /100 | #62 | Exceptional 94.0% |
| Ukrainians | 99.8 /100 | #63 | Exceptional 94.0% |
| Immigrants | Sweden | 99.8 /100 | #64 | Exceptional 93.9% |
| Native Hawaiians | 99.8 /100 | #65 | Exceptional 93.9% |
| Alaskan Athabascans | 99.8 /100 | #66 | Exceptional 93.9% |
| Immigrants | Netherlands | 99.8 /100 | #67 | Exceptional 93.9% |
| Zimbabweans | 99.8 /100 | #68 | Exceptional 93.9% |
| Scotch-Irish | 99.8 /100 | #69 | Exceptional 93.9% |
Demographics Similar to Immigrants from Sierra Leone by 11th Grade
In terms of 11th grade, the demographic groups most similar to Immigrants from Sierra Leone are Somali (92.1%, a difference of 0.010%), Immigrants from Southern Europe (92.1%, a difference of 0.030%), Blackfeet (92.0%, a difference of 0.030%), Portuguese (92.0%, a difference of 0.030%), and Afghan (92.1%, a difference of 0.040%).
| Demographics | Rating | Rank | 11th Grade |
| Ethiopians | 18.8 /100 | #210 | Poor 92.2% |
| Immigrants | Micronesia | 17.7 /100 | #211 | Poor 92.2% |
| Koreans | 14.4 /100 | #212 | Poor 92.1% |
| Immigrants | Ethiopia | 13.9 /100 | #213 | Poor 92.1% |
| Afghans | 12.8 /100 | #214 | Poor 92.1% |
| Immigrants | Southern Europe | 12.5 /100 | #215 | Poor 92.1% |
| Somalis | 11.6 /100 | #216 | Poor 92.1% |
| Immigrants | Sierra Leone | 11.1 /100 | #217 | Poor 92.0% |
| Blackfeet | 10.1 /100 | #218 | Poor 92.0% |
| Portuguese | 10.0 /100 | #219 | Tragic 92.0% |
| South American Indians | 7.6 /100 | #220 | Tragic 92.0% |
| Immigrants | Liberia | 7.0 /100 | #221 | Tragic 91.9% |
| Immigrants | Africa | 6.5 /100 | #222 | Tragic 91.9% |
| Immigrants | Bahamas | 6.5 /100 | #223 | Tragic 91.9% |
| Costa Ricans | 6.3 /100 | #224 | Tragic 91.9% |