Ugandan vs Immigrants from Uganda 10th Grade
COMPARE
Ugandan
Immigrants from Uganda
10th Grade
10th Grade Comparison
Ugandans
Immigrants from Uganda
94.0%
10TH GRADE
80.7/ 100
METRIC RATING
149th/ 347
METRIC RANK
93.5%
10TH GRADE
20.9/ 100
METRIC RATING
202nd/ 347
METRIC RANK
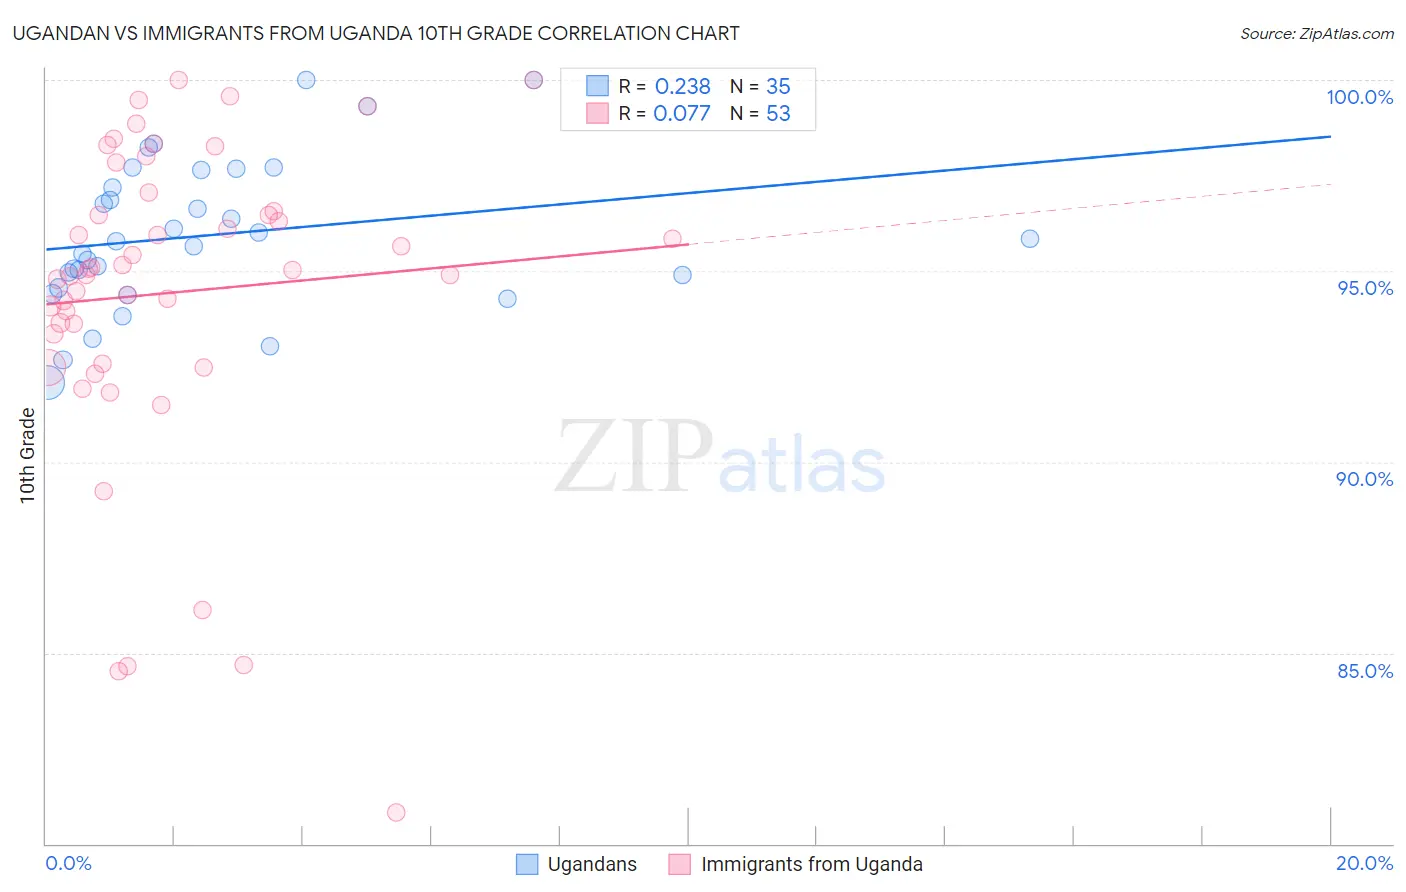
Ugandan vs Immigrants from Uganda 10th Grade Correlation Chart
The statistical analysis conducted on geographies consisting of 93,990,882 people shows a weak positive correlation between the proportion of Ugandans and percentage of population with at least 10th grade education in the United States with a correlation coefficient (R) of 0.238 and weighted average of 94.0%. Similarly, the statistical analysis conducted on geographies consisting of 125,970,180 people shows a slight positive correlation between the proportion of Immigrants from Uganda and percentage of population with at least 10th grade education in the United States with a correlation coefficient (R) of 0.077 and weighted average of 93.5%, a difference of 0.62%.
10th Grade Correlation Summary
| Measurement | Ugandan | Immigrants from Uganda |
| Minimum | 92.1% | 80.8% |
| Maximum | 100.0% | 100.0% |
| Range | 7.9% | 19.2% |
| Mean | 95.9% | 94.4% |
| Median | 95.8% | 95.0% |
| Interquartile 25% (IQ1) | 94.6% | 93.0% |
| Interquartile 75% (IQ3) | 97.6% | 96.8% |
| Interquartile Range (IQR) | 3.1% | 3.8% |
| Standard Deviation (Sample) | 2.0% | 4.1% |
| Standard Deviation (Population) | 1.9% | 4.1% |
Similar Demographics by 10th Grade
Demographics Similar to Ugandans by 10th Grade
In terms of 10th grade, the demographic groups most similar to Ugandans are Arab (94.0%, a difference of 0.0%), Immigrants from Ukraine (94.0%, a difference of 0.010%), Egyptian (94.0%, a difference of 0.020%), Kenyan (94.0%, a difference of 0.020%), and Chickasaw (94.1%, a difference of 0.030%).
| Demographics | Rating | Rank | 10th Grade |
| Albanians | 86.5 /100 | #142 | Excellent 94.1% |
| Cherokee | 84.9 /100 | #143 | Excellent 94.1% |
| Immigrants | Kazakhstan | 84.9 /100 | #144 | Excellent 94.1% |
| Immigrants | Nonimmigrants | 83.8 /100 | #145 | Excellent 94.1% |
| Chickasaw | 82.6 /100 | #146 | Excellent 94.1% |
| Immigrants | Ukraine | 81.5 /100 | #147 | Excellent 94.0% |
| Arabs | 80.9 /100 | #148 | Excellent 94.0% |
| Ugandans | 80.7 /100 | #149 | Excellent 94.0% |
| Egyptians | 79.6 /100 | #150 | Good 94.0% |
| Kenyans | 79.1 /100 | #151 | Good 94.0% |
| Immigrants | Italy | 78.0 /100 | #152 | Good 94.0% |
| Immigrants | Brazil | 75.5 /100 | #153 | Good 94.0% |
| Immigrants | Kenya | 75.3 /100 | #154 | Good 94.0% |
| Spanish | 74.9 /100 | #155 | Good 94.0% |
| Mongolians | 74.4 /100 | #156 | Good 94.0% |
Demographics Similar to Immigrants from Uganda by 10th Grade
In terms of 10th grade, the demographic groups most similar to Immigrants from Uganda are Hawaiian (93.5%, a difference of 0.010%), Immigrants from Western Asia (93.4%, a difference of 0.010%), Ute (93.4%, a difference of 0.010%), Immigrants from Indonesia (93.4%, a difference of 0.010%), and Immigrants from Sudan (93.4%, a difference of 0.010%).
| Demographics | Rating | Rank | 10th Grade |
| Cheyenne | 26.8 /100 | #195 | Fair 93.5% |
| Moroccans | 25.3 /100 | #196 | Fair 93.5% |
| Pueblo | 23.9 /100 | #197 | Fair 93.5% |
| Immigrants | Micronesia | 23.2 /100 | #198 | Fair 93.5% |
| Asians | 23.0 /100 | #199 | Fair 93.5% |
| Hopi | 22.2 /100 | #200 | Fair 93.5% |
| Hawaiians | 21.8 /100 | #201 | Fair 93.5% |
| Immigrants | Uganda | 20.9 /100 | #202 | Fair 93.5% |
| Immigrants | Western Asia | 20.6 /100 | #203 | Fair 93.4% |
| Ute | 20.3 /100 | #204 | Fair 93.4% |
| Immigrants | Indonesia | 20.2 /100 | #205 | Fair 93.4% |
| Immigrants | Sudan | 20.0 /100 | #206 | Fair 93.4% |
| Samoans | 19.5 /100 | #207 | Poor 93.4% |
| Immigrants | Syria | 19.4 /100 | #208 | Poor 93.4% |
| Immigrants | Chile | 18.8 /100 | #209 | Poor 93.4% |