Jamaican vs Immigrants from Iraq Bachelor's Degree
COMPARE
Jamaican
Immigrants from Iraq
Bachelor's Degree
Bachelor's Degree Comparison
Jamaicans
Immigrants from Iraq
33.6%
BACHELOR'S DEGREE
1.0/ 100
METRIC RATING
246th/ 347
METRIC RANK
37.9%
BACHELOR'S DEGREE
52.5/ 100
METRIC RATING
173rd/ 347
METRIC RANK
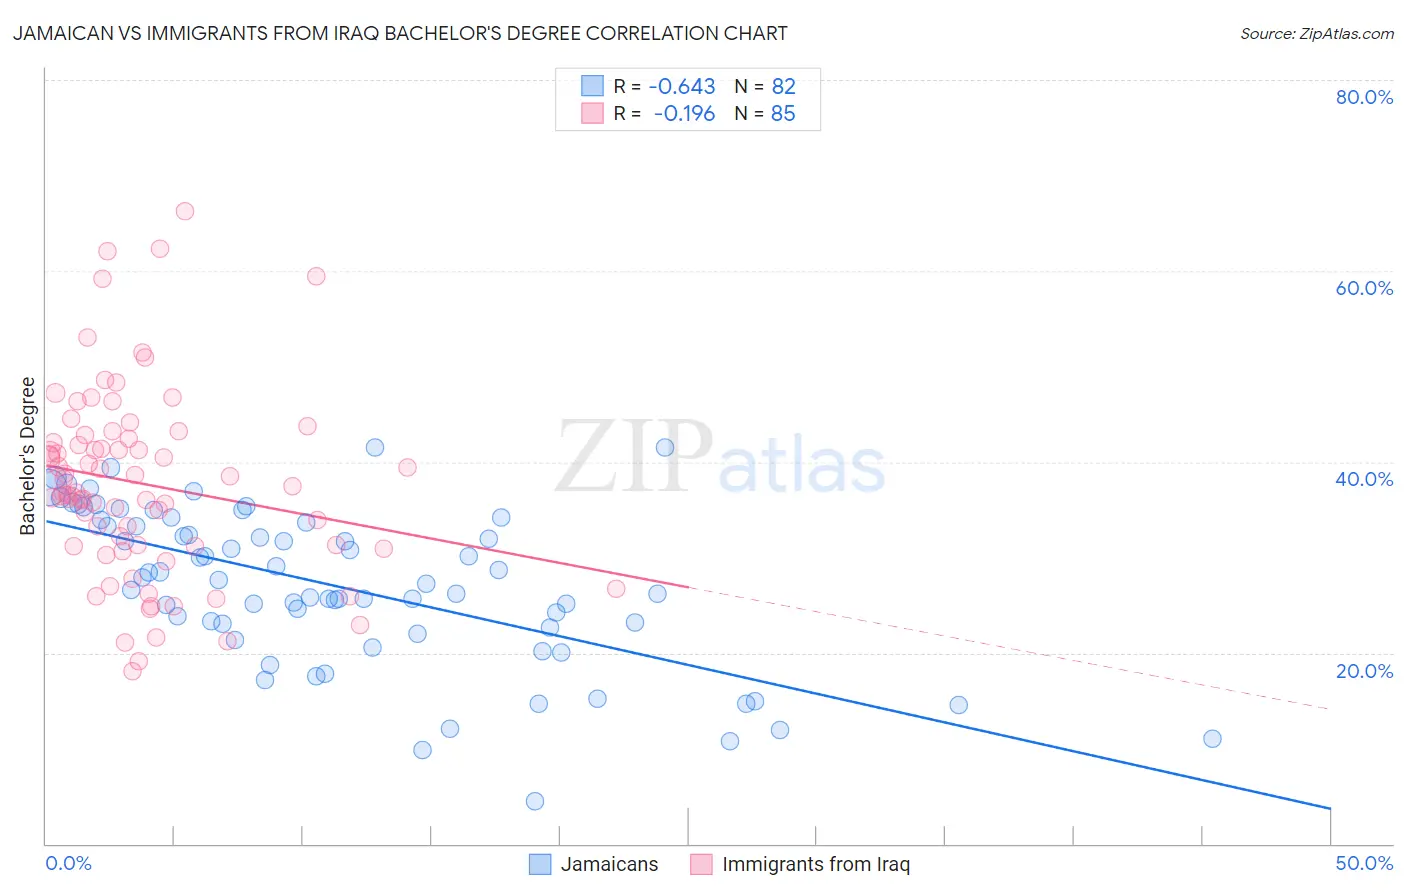
Jamaican vs Immigrants from Iraq Bachelor's Degree Correlation Chart
The statistical analysis conducted on geographies consisting of 368,011,400 people shows a significant negative correlation between the proportion of Jamaicans and percentage of population with at least bachelor's degree education in the United States with a correlation coefficient (R) of -0.643 and weighted average of 33.6%. Similarly, the statistical analysis conducted on geographies consisting of 194,775,437 people shows a poor negative correlation between the proportion of Immigrants from Iraq and percentage of population with at least bachelor's degree education in the United States with a correlation coefficient (R) of -0.196 and weighted average of 37.9%, a difference of 12.8%.
Bachelor's Degree Correlation Summary
| Measurement | Jamaican | Immigrants from Iraq |
| Minimum | 4.5% | 18.0% |
| Maximum | 41.5% | 66.3% |
| Range | 37.0% | 48.3% |
| Mean | 27.0% | 37.7% |
| Median | 27.5% | 36.8% |
| Interquartile 25% (IQ1) | 22.7% | 31.2% |
| Interquartile 75% (IQ3) | 33.7% | 42.7% |
| Interquartile Range (IQR) | 11.0% | 11.5% |
| Standard Deviation (Sample) | 8.2% | 9.9% |
| Standard Deviation (Population) | 8.1% | 9.8% |
Similar Demographics by Bachelor's Degree
Demographics Similar to Jamaicans by Bachelor's Degree
In terms of bachelor's degree, the demographic groups most similar to Jamaicans are Immigrants from Congo (33.6%, a difference of 0.090%), Cree (33.6%, a difference of 0.10%), Immigrants from Liberia (33.5%, a difference of 0.23%), Indonesian (33.5%, a difference of 0.24%), and Immigrants from Fiji (33.7%, a difference of 0.36%).
| Demographics | Rating | Rank | Bachelor's Degree |
| British West Indians | 2.5 /100 | #239 | Tragic 34.5% |
| Tongans | 2.0 /100 | #240 | Tragic 34.3% |
| Immigrants | Cambodia | 1.9 /100 | #241 | Tragic 34.2% |
| Immigrants | Nonimmigrants | 1.8 /100 | #242 | Tragic 34.2% |
| Immigrants | Guyana | 1.4 /100 | #243 | Tragic 33.9% |
| Delaware | 1.2 /100 | #244 | Tragic 33.8% |
| Immigrants | Fiji | 1.2 /100 | #245 | Tragic 33.7% |
| Jamaicans | 1.0 /100 | #246 | Tragic 33.6% |
| Immigrants | Congo | 1.0 /100 | #247 | Tragic 33.6% |
| Cree | 1.0 /100 | #248 | Tragic 33.6% |
| Immigrants | Liberia | 0.9 /100 | #249 | Tragic 33.5% |
| Indonesians | 0.9 /100 | #250 | Tragic 33.5% |
| Japanese | 0.7 /100 | #251 | Tragic 33.3% |
| Immigrants | Bahamas | 0.7 /100 | #252 | Tragic 33.3% |
| U.S. Virgin Islanders | 0.7 /100 | #253 | Tragic 33.2% |
Demographics Similar to Immigrants from Iraq by Bachelor's Degree
In terms of bachelor's degree, the demographic groups most similar to Immigrants from Iraq are Immigrants from Somalia (37.9%, a difference of 0.020%), Bermudan (38.0%, a difference of 0.16%), Czech (38.0%, a difference of 0.18%), Immigrants from Bangladesh (37.8%, a difference of 0.25%), and Ghanaian (38.0%, a difference of 0.27%).
| Demographics | Rating | Rank | Bachelor's Degree |
| Somalis | 58.6 /100 | #166 | Average 38.1% |
| Scottish | 56.6 /100 | #167 | Average 38.1% |
| Danes | 56.2 /100 | #168 | Average 38.1% |
| Ghanaians | 55.3 /100 | #169 | Average 38.0% |
| Czechs | 54.4 /100 | #170 | Average 38.0% |
| Bermudans | 54.2 /100 | #171 | Average 38.0% |
| Immigrants | Somalia | 52.8 /100 | #172 | Average 37.9% |
| Immigrants | Iraq | 52.5 /100 | #173 | Average 37.9% |
| Immigrants | Bangladesh | 50.0 /100 | #174 | Average 37.8% |
| Immigrants | Uruguay | 48.3 /100 | #175 | Average 37.8% |
| Costa Ricans | 47.6 /100 | #176 | Average 37.7% |
| Basques | 47.4 /100 | #177 | Average 37.7% |
| Immigrants | Cameroon | 46.8 /100 | #178 | Average 37.7% |
| Immigrants | Colombia | 45.4 /100 | #179 | Average 37.7% |
| Irish | 44.3 /100 | #180 | Average 37.6% |