English vs Immigrants from Iraq Bachelor's Degree
COMPARE
English
Immigrants from Iraq
Bachelor's Degree
Bachelor's Degree Comparison
English
Immigrants from Iraq
37.4%
BACHELOR'S DEGREE
39.7/ 100
METRIC RATING
187th/ 347
METRIC RANK
37.9%
BACHELOR'S DEGREE
52.5/ 100
METRIC RATING
173rd/ 347
METRIC RANK
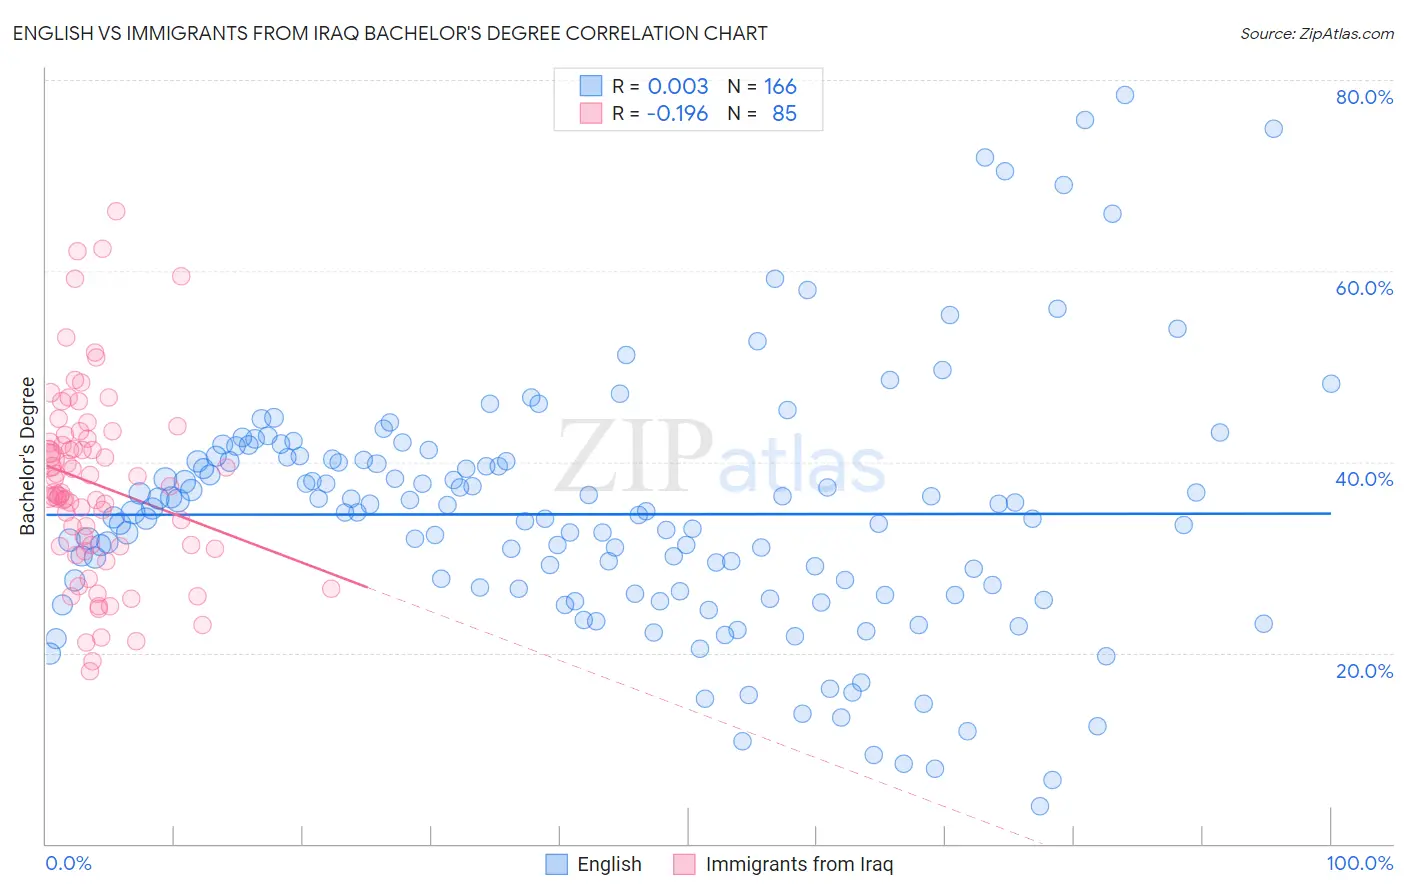
English vs Immigrants from Iraq Bachelor's Degree Correlation Chart
The statistical analysis conducted on geographies consisting of 579,675,473 people shows no correlation between the proportion of English and percentage of population with at least bachelor's degree education in the United States with a correlation coefficient (R) of 0.003 and weighted average of 37.4%. Similarly, the statistical analysis conducted on geographies consisting of 194,775,437 people shows a poor negative correlation between the proportion of Immigrants from Iraq and percentage of population with at least bachelor's degree education in the United States with a correlation coefficient (R) of -0.196 and weighted average of 37.9%, a difference of 1.3%.
Bachelor's Degree Correlation Summary
| Measurement | English | Immigrants from Iraq |
| Minimum | 3.9% | 18.0% |
| Maximum | 78.4% | 66.3% |
| Range | 74.5% | 48.3% |
| Mean | 34.5% | 37.7% |
| Median | 34.7% | 36.8% |
| Interquartile 25% (IQ1) | 26.5% | 31.2% |
| Interquartile 75% (IQ3) | 40.2% | 42.7% |
| Interquartile Range (IQR) | 13.8% | 11.5% |
| Standard Deviation (Sample) | 13.1% | 9.9% |
| Standard Deviation (Population) | 13.1% | 9.8% |
Demographics Similar to English and Immigrants from Iraq by Bachelor's Degree
In terms of bachelor's degree, the demographic groups most similar to English are Norwegian (37.5%, a difference of 0.070%), Immigrants from Peru (37.5%, a difference of 0.17%), Scandinavian (37.5%, a difference of 0.21%), Immigrants from Oceania (37.3%, a difference of 0.24%), and Senegalese (37.5%, a difference of 0.26%). Similarly, the demographic groups most similar to Immigrants from Iraq are Immigrants from Somalia (37.9%, a difference of 0.020%), Bermudan (38.0%, a difference of 0.16%), Czech (38.0%, a difference of 0.18%), Immigrants from Bangladesh (37.8%, a difference of 0.25%), and Immigrants from Uruguay (37.8%, a difference of 0.41%).
| Demographics | Rating | Rank | Bachelor's Degree |
| Czechs | 54.4 /100 | #170 | Average 38.0% |
| Bermudans | 54.2 /100 | #171 | Average 38.0% |
| Immigrants | Somalia | 52.8 /100 | #172 | Average 37.9% |
| Immigrants | Iraq | 52.5 /100 | #173 | Average 37.9% |
| Immigrants | Bangladesh | 50.0 /100 | #174 | Average 37.8% |
| Immigrants | Uruguay | 48.3 /100 | #175 | Average 37.8% |
| Costa Ricans | 47.6 /100 | #176 | Average 37.7% |
| Basques | 47.4 /100 | #177 | Average 37.7% |
| Immigrants | Cameroon | 46.8 /100 | #178 | Average 37.7% |
| Immigrants | Colombia | 45.4 /100 | #179 | Average 37.7% |
| Irish | 44.3 /100 | #180 | Average 37.6% |
| Immigrants | Senegal | 43.8 /100 | #181 | Average 37.6% |
| Immigrants | Bosnia and Herzegovina | 43.4 /100 | #182 | Average 37.6% |
| Senegalese | 42.2 /100 | #183 | Average 37.5% |
| Scandinavians | 41.7 /100 | #184 | Average 37.5% |
| Immigrants | Peru | 41.3 /100 | #185 | Average 37.5% |
| Norwegians | 40.4 /100 | #186 | Average 37.5% |
| English | 39.7 /100 | #187 | Fair 37.4% |
| Immigrants | Oceania | 37.3 /100 | #188 | Fair 37.3% |
| Slovaks | 36.9 /100 | #189 | Fair 37.3% |
| Swiss | 34.1 /100 | #190 | Fair 37.2% |