Salvadoran vs Hmong Bachelor's Degree
COMPARE
Salvadoran
Hmong
Bachelor's Degree
Bachelor's Degree Comparison
Salvadorans
Hmong
31.8%
BACHELOR'S DEGREE
0.1/ 100
METRIC RATING
276th/ 347
METRIC RANK
34.8%
BACHELOR'S DEGREE
3.4/ 100
METRIC RATING
232nd/ 347
METRIC RANK
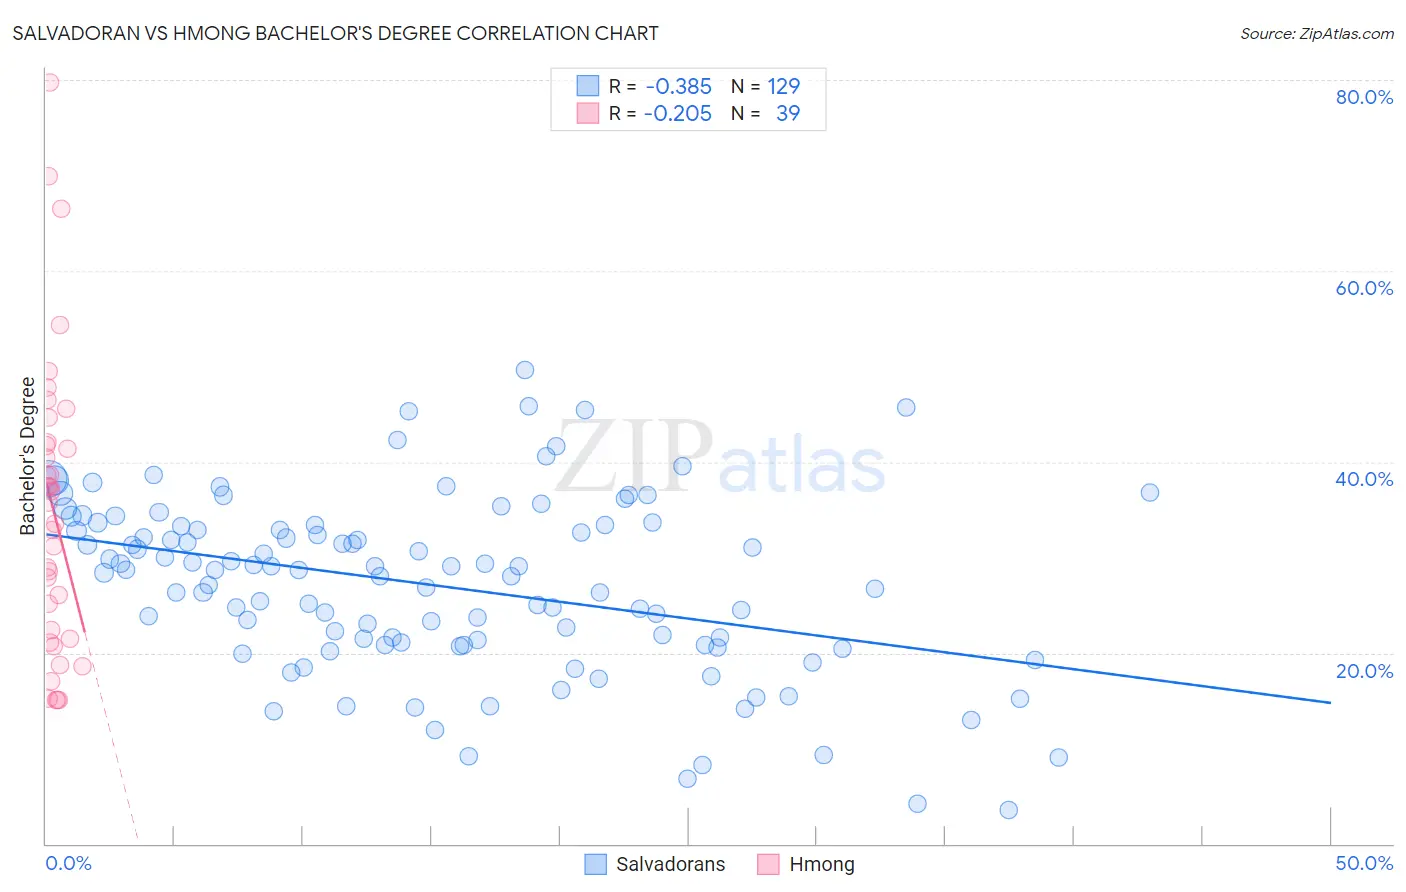
Salvadoran vs Hmong Bachelor's Degree Correlation Chart
The statistical analysis conducted on geographies consisting of 399,013,462 people shows a mild negative correlation between the proportion of Salvadorans and percentage of population with at least bachelor's degree education in the United States with a correlation coefficient (R) of -0.385 and weighted average of 31.8%. Similarly, the statistical analysis conducted on geographies consisting of 24,680,511 people shows a weak negative correlation between the proportion of Hmong and percentage of population with at least bachelor's degree education in the United States with a correlation coefficient (R) of -0.205 and weighted average of 34.8%, a difference of 9.3%.
Bachelor's Degree Correlation Summary
| Measurement | Salvadoran | Hmong |
| Minimum | 3.6% | 15.0% |
| Maximum | 49.6% | 79.7% |
| Range | 46.0% | 64.7% |
| Mean | 27.1% | 35.0% |
| Median | 28.7% | 35.8% |
| Interquartile 25% (IQ1) | 20.8% | 21.5% |
| Interquartile 75% (IQ3) | 33.3% | 42.0% |
| Interquartile Range (IQR) | 12.5% | 20.5% |
| Standard Deviation (Sample) | 9.2% | 15.4% |
| Standard Deviation (Population) | 9.2% | 15.2% |
Similar Demographics by Bachelor's Degree
Demographics Similar to Salvadorans by Bachelor's Degree
In terms of bachelor's degree, the demographic groups most similar to Salvadorans are Samoan (31.8%, a difference of 0.040%), Dominican (31.8%, a difference of 0.15%), Potawatomi (31.9%, a difference of 0.17%), American (31.9%, a difference of 0.19%), and Marshallese (31.7%, a difference of 0.20%).
| Demographics | Rating | Rank | Bachelor's Degree |
| Immigrants | Belize | 0.2 /100 | #269 | Tragic 32.1% |
| Immigrants | Nicaragua | 0.2 /100 | #270 | Tragic 31.9% |
| Central Americans | 0.2 /100 | #271 | Tragic 31.9% |
| Comanche | 0.2 /100 | #272 | Tragic 31.9% |
| Americans | 0.2 /100 | #273 | Tragic 31.9% |
| Potawatomi | 0.2 /100 | #274 | Tragic 31.9% |
| Samoans | 0.1 /100 | #275 | Tragic 31.8% |
| Salvadorans | 0.1 /100 | #276 | Tragic 31.8% |
| Dominicans | 0.1 /100 | #277 | Tragic 31.8% |
| Marshallese | 0.1 /100 | #278 | Tragic 31.7% |
| Hawaiians | 0.1 /100 | #279 | Tragic 31.6% |
| Immigrants | Laos | 0.1 /100 | #280 | Tragic 31.6% |
| Blackfeet | 0.1 /100 | #281 | Tragic 31.5% |
| Immigrants | Caribbean | 0.1 /100 | #282 | Tragic 31.4% |
| Hondurans | 0.1 /100 | #283 | Tragic 31.3% |
Demographics Similar to Hmong by Bachelor's Degree
In terms of bachelor's degree, the demographic groups most similar to Hmong are Immigrants from Ecuador (34.7%, a difference of 0.11%), Guamanian/Chamorro (34.6%, a difference of 0.32%), Immigrants from West Indies (34.6%, a difference of 0.42%), Liberian (34.6%, a difference of 0.52%), and Tlingit-Haida (34.6%, a difference of 0.56%).
| Demographics | Rating | Rank | Bachelor's Degree |
| Immigrants | Burma/Myanmar | 7.3 /100 | #225 | Tragic 35.5% |
| Portuguese | 7.2 /100 | #226 | Tragic 35.5% |
| Ecuadorians | 6.6 /100 | #227 | Tragic 35.4% |
| Immigrants | Trinidad and Tobago | 6.0 /100 | #228 | Tragic 35.3% |
| Whites/Caucasians | 5.9 /100 | #229 | Tragic 35.3% |
| Immigrants | Grenada | 4.3 /100 | #230 | Tragic 35.0% |
| Immigrants | St. Vincent and the Grenadines | 4.3 /100 | #231 | Tragic 35.0% |
| Hmong | 3.4 /100 | #232 | Tragic 34.8% |
| Immigrants | Ecuador | 3.3 /100 | #233 | Tragic 34.7% |
| Guamanians/Chamorros | 3.0 /100 | #234 | Tragic 34.6% |
| Immigrants | West Indies | 2.9 /100 | #235 | Tragic 34.6% |
| Liberians | 2.8 /100 | #236 | Tragic 34.6% |
| Tlingit-Haida | 2.8 /100 | #237 | Tragic 34.6% |
| Guyanese | 2.5 /100 | #238 | Tragic 34.5% |
| British West Indians | 2.5 /100 | #239 | Tragic 34.5% |