Maltese vs French American Indian Bachelor's Degree
COMPARE
Maltese
French American Indian
Bachelor's Degree
Bachelor's Degree Comparison
Maltese
French American Indians
41.9%
BACHELOR'S DEGREE
98.8/ 100
METRIC RATING
92nd/ 347
METRIC RANK
33.1%
BACHELOR'S DEGREE
0.6/ 100
METRIC RATING
258th/ 347
METRIC RANK
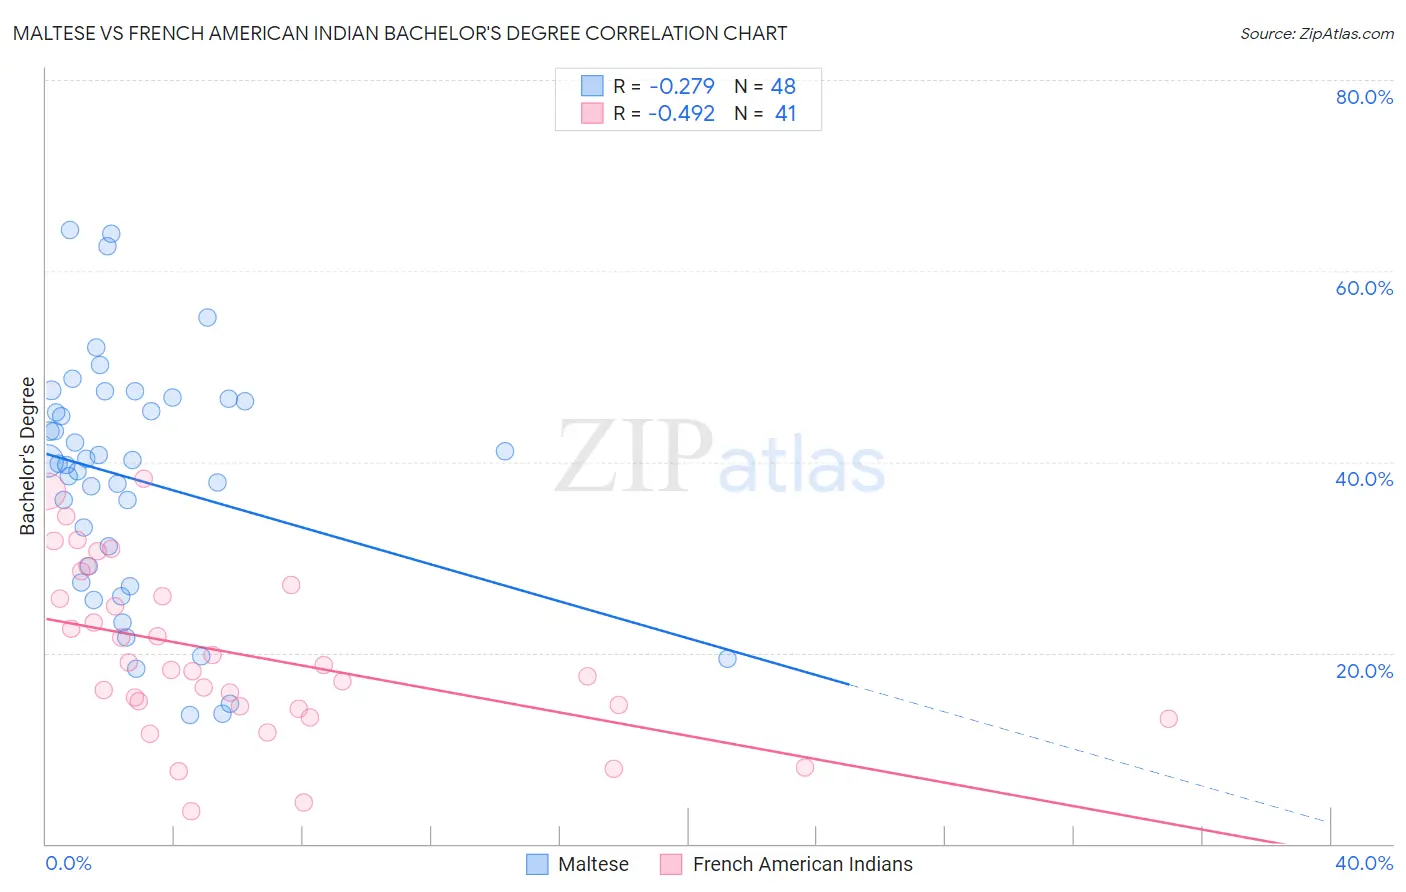
Maltese vs French American Indian Bachelor's Degree Correlation Chart
The statistical analysis conducted on geographies consisting of 126,471,941 people shows a weak negative correlation between the proportion of Maltese and percentage of population with at least bachelor's degree education in the United States with a correlation coefficient (R) of -0.279 and weighted average of 41.9%. Similarly, the statistical analysis conducted on geographies consisting of 131,974,531 people shows a moderate negative correlation between the proportion of French American Indians and percentage of population with at least bachelor's degree education in the United States with a correlation coefficient (R) of -0.492 and weighted average of 33.1%, a difference of 26.8%.
Bachelor's Degree Correlation Summary
| Measurement | Maltese | French American Indian |
| Minimum | 13.5% | 3.4% |
| Maximum | 64.2% | 38.2% |
| Range | 50.8% | 34.8% |
| Mean | 38.1% | 19.9% |
| Median | 40.0% | 18.3% |
| Interquartile 25% (IQ1) | 28.2% | 14.3% |
| Interquartile 75% (IQ3) | 46.4% | 26.5% |
| Interquartile Range (IQR) | 18.3% | 12.3% |
| Standard Deviation (Sample) | 12.6% | 8.8% |
| Standard Deviation (Population) | 12.5% | 8.6% |
Similar Demographics by Bachelor's Degree
Demographics Similar to Maltese by Bachelor's Degree
In terms of bachelor's degree, the demographic groups most similar to Maltese are Immigrants from Northern Africa (41.9%, a difference of 0.070%), Laotian (42.0%, a difference of 0.17%), Immigrants from Western Europe (42.0%, a difference of 0.30%), Greek (42.0%, a difference of 0.30%), and Carpatho Rusyn (42.1%, a difference of 0.42%).
| Demographics | Rating | Rank | Bachelor's Degree |
| Lithuanians | 99.2 /100 | #85 | Exceptional 42.2% |
| Immigrants | Brazil | 99.2 /100 | #86 | Exceptional 42.2% |
| Carpatho Rusyns | 99.0 /100 | #87 | Exceptional 42.1% |
| Immigrants | Western Europe | 99.0 /100 | #88 | Exceptional 42.0% |
| Greeks | 99.0 /100 | #89 | Exceptional 42.0% |
| Laotians | 98.9 /100 | #90 | Exceptional 42.0% |
| Immigrants | Northern Africa | 98.9 /100 | #91 | Exceptional 41.9% |
| Maltese | 98.8 /100 | #92 | Exceptional 41.9% |
| Immigrants | Canada | 98.6 /100 | #93 | Exceptional 41.7% |
| Immigrants | Nepal | 98.6 /100 | #94 | Exceptional 41.7% |
| Immigrants | North America | 98.5 /100 | #95 | Exceptional 41.7% |
| Immigrants | Moldova | 98.4 /100 | #96 | Exceptional 41.6% |
| Romanians | 98.4 /100 | #97 | Exceptional 41.6% |
| Immigrants | Ukraine | 98.3 /100 | #98 | Exceptional 41.5% |
| Immigrants | England | 98.1 /100 | #99 | Exceptional 41.4% |
Demographics Similar to French American Indians by Bachelor's Degree
In terms of bachelor's degree, the demographic groups most similar to French American Indians are Spanish American (33.1%, a difference of 0.040%), Osage (33.0%, a difference of 0.050%), Nicaraguan (33.1%, a difference of 0.26%), Malaysian (32.9%, a difference of 0.41%), and Iroquois (33.2%, a difference of 0.45%).
| Demographics | Rating | Rank | Bachelor's Degree |
| Japanese | 0.7 /100 | #251 | Tragic 33.3% |
| Immigrants | Bahamas | 0.7 /100 | #252 | Tragic 33.3% |
| U.S. Virgin Islanders | 0.7 /100 | #253 | Tragic 33.2% |
| Native Hawaiians | 0.7 /100 | #254 | Tragic 33.2% |
| Iroquois | 0.7 /100 | #255 | Tragic 33.2% |
| Nicaraguans | 0.6 /100 | #256 | Tragic 33.1% |
| Spanish Americans | 0.6 /100 | #257 | Tragic 33.1% |
| French American Indians | 0.6 /100 | #258 | Tragic 33.1% |
| Osage | 0.5 /100 | #259 | Tragic 33.0% |
| Malaysians | 0.5 /100 | #260 | Tragic 32.9% |
| Africans | 0.5 /100 | #261 | Tragic 32.9% |
| Immigrants | Jamaica | 0.5 /100 | #262 | Tragic 32.9% |
| Belizeans | 0.4 /100 | #263 | Tragic 32.8% |
| Central American Indians | 0.3 /100 | #264 | Tragic 32.5% |
| Bahamians | 0.3 /100 | #265 | Tragic 32.5% |