Immigrants from Romania vs French American Indian Bachelor's Degree
COMPARE
Immigrants from Romania
French American Indian
Bachelor's Degree
Bachelor's Degree Comparison
Immigrants from Romania
French American Indians
42.9%
BACHELOR'S DEGREE
99.6/ 100
METRIC RATING
70th/ 347
METRIC RANK
33.1%
BACHELOR'S DEGREE
0.6/ 100
METRIC RATING
258th/ 347
METRIC RANK
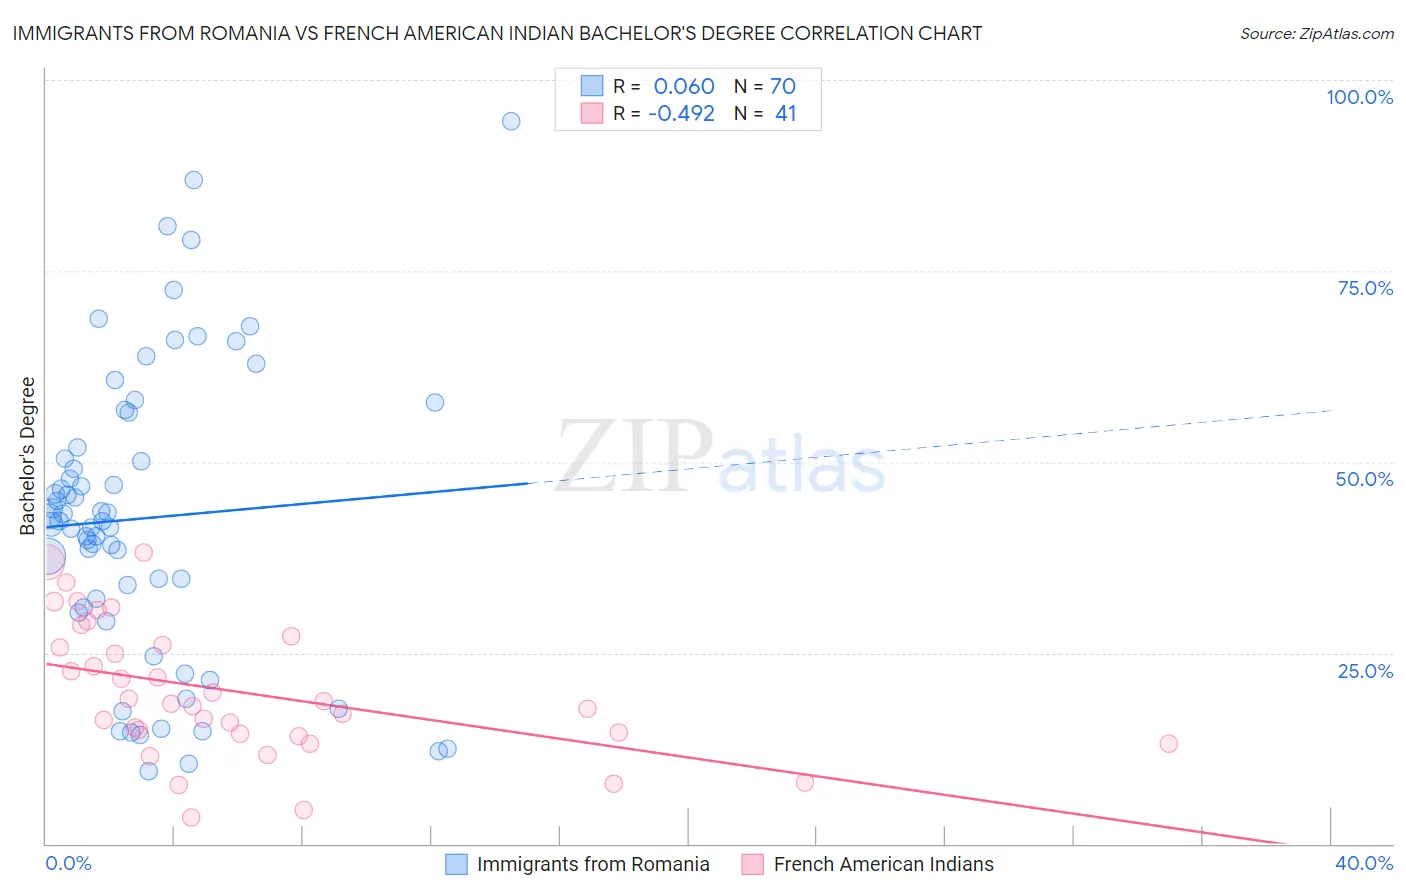
Immigrants from Romania vs French American Indian Bachelor's Degree Correlation Chart
The statistical analysis conducted on geographies consisting of 257,014,107 people shows a slight positive correlation between the proportion of Immigrants from Romania and percentage of population with at least bachelor's degree education in the United States with a correlation coefficient (R) of 0.060 and weighted average of 42.9%. Similarly, the statistical analysis conducted on geographies consisting of 131,974,531 people shows a moderate negative correlation between the proportion of French American Indians and percentage of population with at least bachelor's degree education in the United States with a correlation coefficient (R) of -0.492 and weighted average of 33.1%, a difference of 29.9%.
Bachelor's Degree Correlation Summary
| Measurement | Immigrants from Romania | French American Indian |
| Minimum | 9.6% | 3.4% |
| Maximum | 94.5% | 38.2% |
| Range | 85.0% | 34.8% |
| Mean | 42.6% | 19.9% |
| Median | 42.3% | 18.3% |
| Interquartile 25% (IQ1) | 30.9% | 14.3% |
| Interquartile 75% (IQ3) | 51.9% | 26.5% |
| Interquartile Range (IQR) | 21.0% | 12.3% |
| Standard Deviation (Sample) | 19.2% | 8.8% |
| Standard Deviation (Population) | 19.1% | 8.6% |
Similar Demographics by Bachelor's Degree
Demographics Similar to Immigrants from Romania by Bachelor's Degree
In terms of bachelor's degree, the demographic groups most similar to Immigrants from Romania are Immigrants from Argentina (42.8%, a difference of 0.26%), Ethiopian (42.8%, a difference of 0.35%), Immigrants from Uzbekistan (42.8%, a difference of 0.40%), Immigrants from Pakistan (43.1%, a difference of 0.49%), and Bhutanese (42.7%, a difference of 0.62%).
| Demographics | Rating | Rank | Bachelor's Degree |
| Immigrants | Europe | 99.8 /100 | #63 | Exceptional 43.4% |
| Argentineans | 99.7 /100 | #64 | Exceptional 43.3% |
| Zimbabweans | 99.7 /100 | #65 | Exceptional 43.3% |
| Immigrants | Netherlands | 99.7 /100 | #66 | Exceptional 43.3% |
| Egyptians | 99.7 /100 | #67 | Exceptional 43.3% |
| Immigrants | Indonesia | 99.7 /100 | #68 | Exceptional 43.3% |
| Immigrants | Pakistan | 99.7 /100 | #69 | Exceptional 43.1% |
| Immigrants | Romania | 99.6 /100 | #70 | Exceptional 42.9% |
| Immigrants | Argentina | 99.6 /100 | #71 | Exceptional 42.8% |
| Ethiopians | 99.5 /100 | #72 | Exceptional 42.8% |
| Immigrants | Uzbekistan | 99.5 /100 | #73 | Exceptional 42.8% |
| Bhutanese | 99.5 /100 | #74 | Exceptional 42.7% |
| Immigrants | Zimbabwe | 99.4 /100 | #75 | Exceptional 42.6% |
| Immigrants | Egypt | 99.4 /100 | #76 | Exceptional 42.6% |
| Immigrants | Eastern Europe | 99.4 /100 | #77 | Exceptional 42.5% |
Demographics Similar to French American Indians by Bachelor's Degree
In terms of bachelor's degree, the demographic groups most similar to French American Indians are Spanish American (33.1%, a difference of 0.040%), Osage (33.0%, a difference of 0.050%), Nicaraguan (33.1%, a difference of 0.26%), Malaysian (32.9%, a difference of 0.41%), and Iroquois (33.2%, a difference of 0.45%).
| Demographics | Rating | Rank | Bachelor's Degree |
| Japanese | 0.7 /100 | #251 | Tragic 33.3% |
| Immigrants | Bahamas | 0.7 /100 | #252 | Tragic 33.3% |
| U.S. Virgin Islanders | 0.7 /100 | #253 | Tragic 33.2% |
| Native Hawaiians | 0.7 /100 | #254 | Tragic 33.2% |
| Iroquois | 0.7 /100 | #255 | Tragic 33.2% |
| Nicaraguans | 0.6 /100 | #256 | Tragic 33.1% |
| Spanish Americans | 0.6 /100 | #257 | Tragic 33.1% |
| French American Indians | 0.6 /100 | #258 | Tragic 33.1% |
| Osage | 0.5 /100 | #259 | Tragic 33.0% |
| Malaysians | 0.5 /100 | #260 | Tragic 32.9% |
| Africans | 0.5 /100 | #261 | Tragic 32.9% |
| Immigrants | Jamaica | 0.5 /100 | #262 | Tragic 32.9% |
| Belizeans | 0.4 /100 | #263 | Tragic 32.8% |
| Central American Indians | 0.3 /100 | #264 | Tragic 32.5% |
| Bahamians | 0.3 /100 | #265 | Tragic 32.5% |