Australian vs Immigrants from Sierra Leone Associate's Degree
COMPARE
Australian
Immigrants from Sierra Leone
Associate's Degree
Associate's Degree Comparison
Australians
Immigrants from Sierra Leone
51.9%
ASSOCIATE'S DEGREE
99.8/ 100
METRIC RATING
55th/ 347
METRIC RANK
46.7%
ASSOCIATE'S DEGREE
59.2/ 100
METRIC RATING
167th/ 347
METRIC RANK
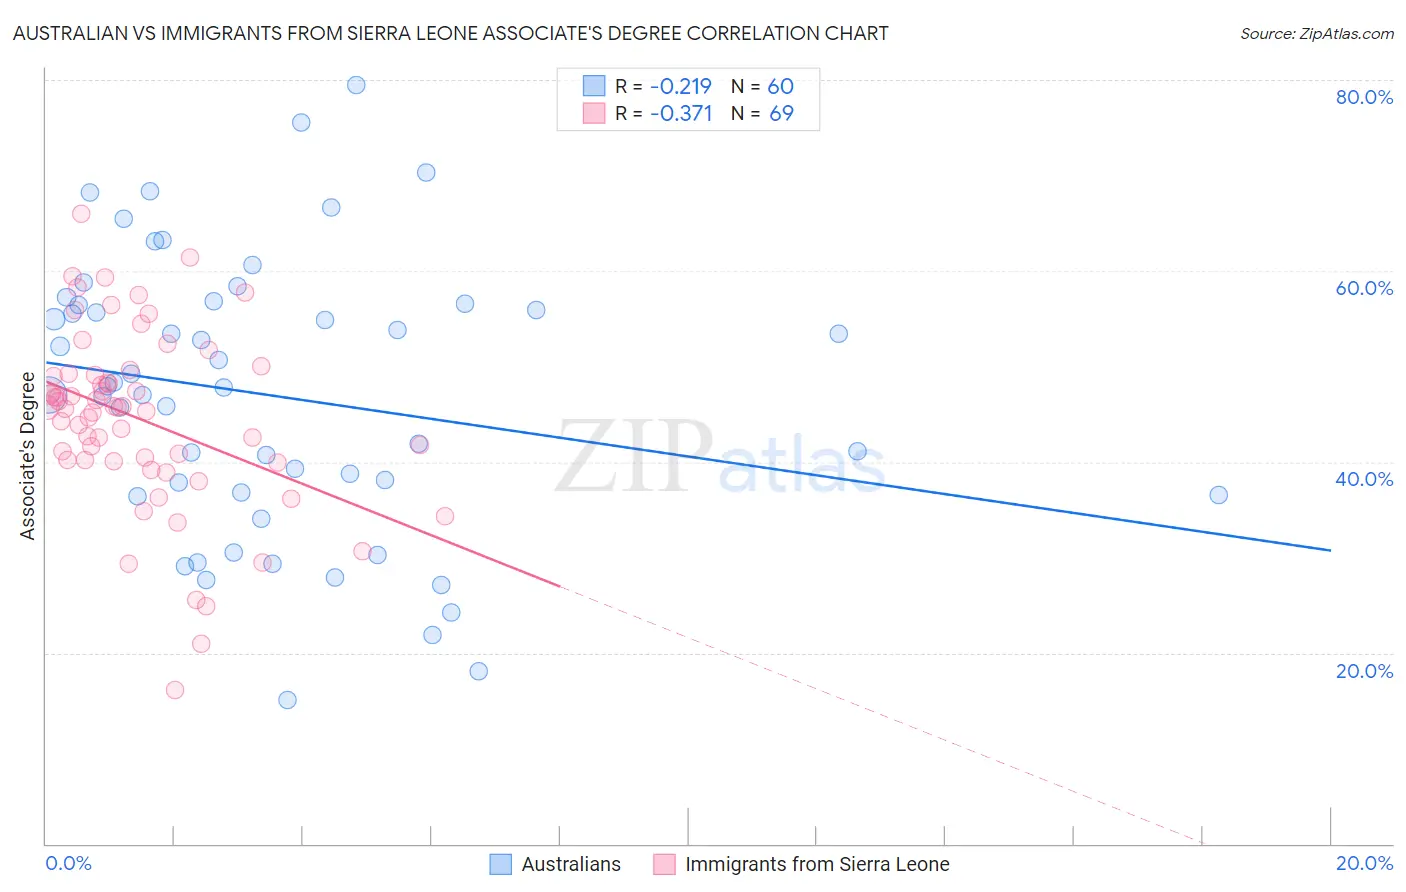
Australian vs Immigrants from Sierra Leone Associate's Degree Correlation Chart
The statistical analysis conducted on geographies consisting of 224,144,542 people shows a weak negative correlation between the proportion of Australians and percentage of population with at least associate's degree education in the United States with a correlation coefficient (R) of -0.219 and weighted average of 51.9%. Similarly, the statistical analysis conducted on geographies consisting of 101,624,736 people shows a mild negative correlation between the proportion of Immigrants from Sierra Leone and percentage of population with at least associate's degree education in the United States with a correlation coefficient (R) of -0.371 and weighted average of 46.7%, a difference of 11.2%.
Associate's Degree Correlation Summary
| Measurement | Australian | Immigrants from Sierra Leone |
| Minimum | 15.1% | 16.1% |
| Maximum | 79.5% | 66.0% |
| Range | 64.4% | 50.0% |
| Mean | 47.0% | 44.5% |
| Median | 47.9% | 45.7% |
| Interquartile 25% (IQ1) | 36.7% | 40.1% |
| Interquartile 75% (IQ3) | 56.5% | 49.2% |
| Interquartile Range (IQR) | 19.8% | 9.1% |
| Standard Deviation (Sample) | 14.6% | 9.5% |
| Standard Deviation (Population) | 14.4% | 9.4% |
Similar Demographics by Associate's Degree
Demographics Similar to Australians by Associate's Degree
In terms of associate's degree, the demographic groups most similar to Australians are Immigrants from Czechoslovakia (51.9%, a difference of 0.020%), Immigrants from Spain (51.9%, a difference of 0.030%), Immigrants from Asia (52.0%, a difference of 0.13%), Paraguayan (51.8%, a difference of 0.14%), and Bolivian (52.0%, a difference of 0.16%).
| Demographics | Rating | Rank | Associate's Degree |
| Immigrants | Norway | 99.9 /100 | #48 | Exceptional 52.2% |
| Immigrants | Austria | 99.9 /100 | #49 | Exceptional 52.1% |
| Asians | 99.9 /100 | #50 | Exceptional 52.1% |
| Immigrants | Greece | 99.9 /100 | #51 | Exceptional 52.1% |
| Bolivians | 99.8 /100 | #52 | Exceptional 52.0% |
| Immigrants | Asia | 99.8 /100 | #53 | Exceptional 52.0% |
| Immigrants | Spain | 99.8 /100 | #54 | Exceptional 51.9% |
| Australians | 99.8 /100 | #55 | Exceptional 51.9% |
| Immigrants | Czechoslovakia | 99.8 /100 | #56 | Exceptional 51.9% |
| Paraguayans | 99.8 /100 | #57 | Exceptional 51.8% |
| New Zealanders | 99.8 /100 | #58 | Exceptional 51.8% |
| Immigrants | Serbia | 99.8 /100 | #59 | Exceptional 51.7% |
| Immigrants | Bolivia | 99.7 /100 | #60 | Exceptional 51.5% |
| Immigrants | Kazakhstan | 99.7 /100 | #61 | Exceptional 51.4% |
| Bhutanese | 99.7 /100 | #62 | Exceptional 51.4% |
Demographics Similar to Immigrants from Sierra Leone by Associate's Degree
In terms of associate's degree, the demographic groups most similar to Immigrants from Sierra Leone are Hungarian (46.7%, a difference of 0.010%), Immigrants from South America (46.7%, a difference of 0.050%), Colombian (46.8%, a difference of 0.25%), Somali (46.8%, a difference of 0.26%), and Immigrants from Somalia (46.5%, a difference of 0.29%).
| Demographics | Rating | Rank | Associate's Degree |
| Scottish | 65.4 /100 | #160 | Good 46.9% |
| Scandinavians | 65.2 /100 | #161 | Good 46.9% |
| Immigrants | Africa | 63.2 /100 | #162 | Good 46.8% |
| Somalis | 62.5 /100 | #163 | Good 46.8% |
| Colombians | 62.4 /100 | #164 | Good 46.8% |
| Immigrants | South America | 59.9 /100 | #165 | Average 46.7% |
| Hungarians | 59.3 /100 | #166 | Average 46.7% |
| Immigrants | Sierra Leone | 59.2 /100 | #167 | Average 46.7% |
| Immigrants | Somalia | 55.5 /100 | #168 | Average 46.5% |
| Uruguayans | 55.4 /100 | #169 | Average 46.5% |
| Irish | 53.6 /100 | #170 | Average 46.5% |
| Basques | 52.8 /100 | #171 | Average 46.5% |
| Peruvians | 50.5 /100 | #172 | Average 46.4% |
| Immigrants | Iraq | 50.3 /100 | #173 | Average 46.4% |
| English | 50.0 /100 | #174 | Average 46.4% |