Australian vs Immigrants from Afghanistan Doctorate Degree
COMPARE
Australian
Immigrants from Afghanistan
Doctorate Degree
Doctorate Degree Comparison
Australians
Immigrants from Afghanistan
2.4%
DOCTORATE DEGREE
100.0/ 100
METRIC RATING
51st/ 347
METRIC RANK
1.8%
DOCTORATE DEGREE
44.3/ 100
METRIC RATING
182nd/ 347
METRIC RANK
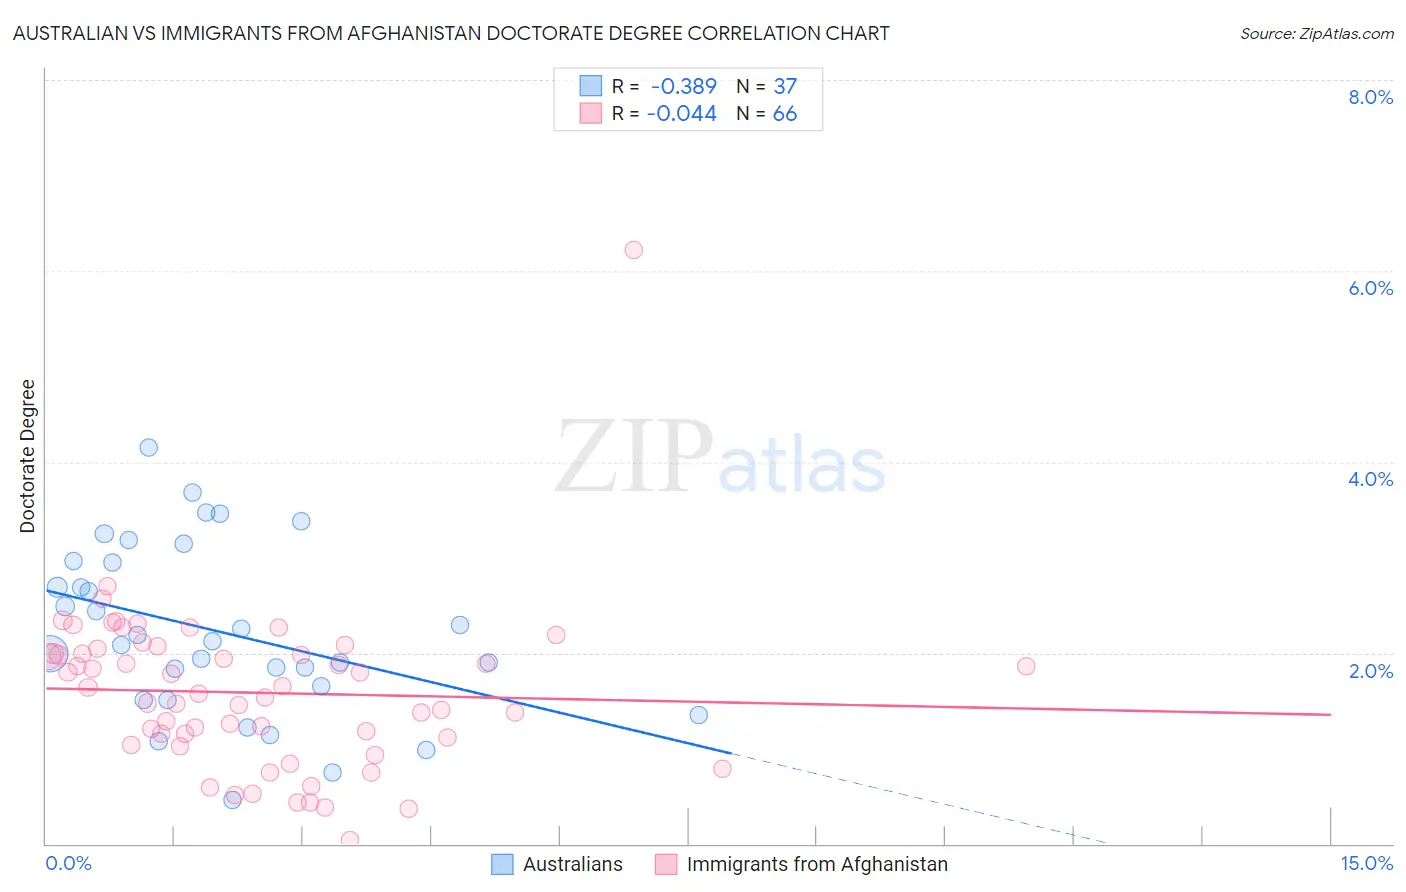
Australian vs Immigrants from Afghanistan Doctorate Degree Correlation Chart
The statistical analysis conducted on geographies consisting of 223,128,872 people shows a mild negative correlation between the proportion of Australians and percentage of population with at least doctorate degree education in the United States with a correlation coefficient (R) of -0.389 and weighted average of 2.4%. Similarly, the statistical analysis conducted on geographies consisting of 147,399,207 people shows no correlation between the proportion of Immigrants from Afghanistan and percentage of population with at least doctorate degree education in the United States with a correlation coefficient (R) of -0.044 and weighted average of 1.8%, a difference of 31.5%.
Doctorate Degree Correlation Summary
| Measurement | Australian | Immigrants from Afghanistan |
| Minimum | 0.45% | 0.038% |
| Maximum | 4.2% | 6.2% |
| Range | 3.7% | 6.2% |
| Mean | 2.2% | 1.6% |
| Median | 2.1% | 1.6% |
| Interquartile 25% (IQ1) | 1.6% | 1.1% |
| Interquartile 75% (IQ3) | 3.0% | 2.0% |
| Interquartile Range (IQR) | 1.4% | 0.88% |
| Standard Deviation (Sample) | 0.88% | 0.86% |
| Standard Deviation (Population) | 0.87% | 0.85% |
Similar Demographics by Doctorate Degree
Demographics Similar to Australians by Doctorate Degree
In terms of doctorate degree, the demographic groups most similar to Australians are Immigrants from Norway (2.4%, a difference of 0.090%), Bulgarian (2.4%, a difference of 0.47%), Immigrants from Latvia (2.4%, a difference of 0.59%), Immigrants from Asia (2.4%, a difference of 1.2%), and Immigrants from Indonesia (2.4%, a difference of 1.3%).
| Demographics | Rating | Rank | Doctorate Degree |
| Immigrants | Netherlands | 100.0 /100 | #44 | Exceptional 2.5% |
| Immigrants | South Africa | 100.0 /100 | #45 | Exceptional 2.4% |
| Immigrants | Austria | 100.0 /100 | #46 | Exceptional 2.4% |
| Immigrants | Western Europe | 100.0 /100 | #47 | Exceptional 2.4% |
| Asians | 100.0 /100 | #48 | Exceptional 2.4% |
| Immigrants | Asia | 100.0 /100 | #49 | Exceptional 2.4% |
| Immigrants | Norway | 100.0 /100 | #50 | Exceptional 2.4% |
| Australians | 100.0 /100 | #51 | Exceptional 2.4% |
| Bulgarians | 100.0 /100 | #52 | Exceptional 2.4% |
| Immigrants | Latvia | 100.0 /100 | #53 | Exceptional 2.4% |
| Immigrants | Indonesia | 100.0 /100 | #54 | Exceptional 2.4% |
| Bolivians | 100.0 /100 | #55 | Exceptional 2.4% |
| Immigrants | Czechoslovakia | 100.0 /100 | #56 | Exceptional 2.4% |
| Immigrants | Ethiopia | 100.0 /100 | #57 | Exceptional 2.4% |
| Ethiopians | 99.9 /100 | #58 | Exceptional 2.3% |
Demographics Similar to Immigrants from Afghanistan by Doctorate Degree
In terms of doctorate degree, the demographic groups most similar to Immigrants from Afghanistan are Immigrants (1.8%, a difference of 0.29%), Finnish (1.8%, a difference of 0.34%), Scandinavian (1.8%, a difference of 0.55%), Ghanaian (1.8%, a difference of 0.60%), and Nigerian (1.8%, a difference of 0.66%).
| Demographics | Rating | Rank | Doctorate Degree |
| Immigrants | Thailand | 49.4 /100 | #175 | Average 1.8% |
| Spanish | 49.3 /100 | #176 | Average 1.8% |
| Iraqis | 49.2 /100 | #177 | Average 1.8% |
| French | 48.8 /100 | #178 | Average 1.8% |
| Ghanaians | 48.3 /100 | #179 | Average 1.8% |
| Scandinavians | 48.0 /100 | #180 | Average 1.8% |
| Immigrants | Immigrants | 46.2 /100 | #181 | Average 1.8% |
| Immigrants | Afghanistan | 44.3 /100 | #182 | Average 1.8% |
| Finns | 42.1 /100 | #183 | Average 1.8% |
| Nigerians | 39.9 /100 | #184 | Fair 1.8% |
| Slovaks | 36.4 /100 | #185 | Fair 1.8% |
| Peruvians | 34.4 /100 | #186 | Fair 1.8% |
| Czechoslovakians | 33.0 /100 | #187 | Fair 1.8% |
| Germans | 30.5 /100 | #188 | Fair 1.8% |
| French Canadians | 30.2 /100 | #189 | Fair 1.8% |