Australian vs Immigrants from Dominica Doctorate Degree
COMPARE
Australian
Immigrants from Dominica
Doctorate Degree
Doctorate Degree Comparison
Australians
Immigrants from Dominica
2.4%
DOCTORATE DEGREE
100.0/ 100
METRIC RATING
51st/ 347
METRIC RANK
1.4%
DOCTORATE DEGREE
0.1/ 100
METRIC RATING
303rd/ 347
METRIC RANK
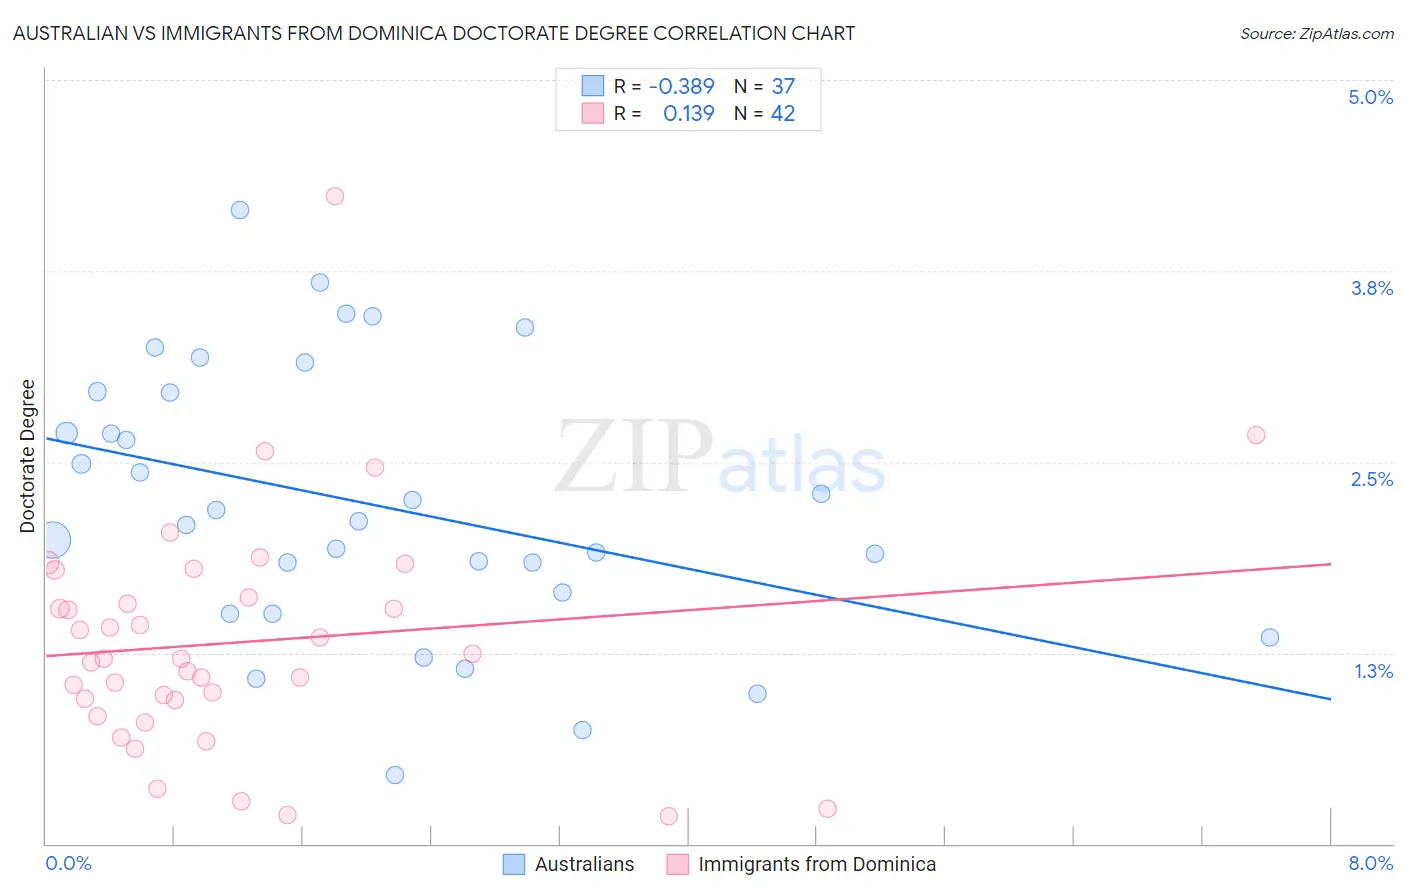
Australian vs Immigrants from Dominica Doctorate Degree Correlation Chart
The statistical analysis conducted on geographies consisting of 223,128,872 people shows a mild negative correlation between the proportion of Australians and percentage of population with at least doctorate degree education in the United States with a correlation coefficient (R) of -0.389 and weighted average of 2.4%. Similarly, the statistical analysis conducted on geographies consisting of 83,662,569 people shows a poor positive correlation between the proportion of Immigrants from Dominica and percentage of population with at least doctorate degree education in the United States with a correlation coefficient (R) of 0.139 and weighted average of 1.4%, a difference of 73.3%.
Doctorate Degree Correlation Summary
| Measurement | Australian | Immigrants from Dominica |
| Minimum | 0.45% | 0.18% |
| Maximum | 4.2% | 4.2% |
| Range | 3.7% | 4.1% |
| Mean | 2.2% | 1.3% |
| Median | 2.1% | 1.2% |
| Interquartile 25% (IQ1) | 1.6% | 0.94% |
| Interquartile 75% (IQ3) | 3.0% | 1.6% |
| Interquartile Range (IQR) | 1.4% | 0.67% |
| Standard Deviation (Sample) | 0.88% | 0.76% |
| Standard Deviation (Population) | 0.87% | 0.75% |
Similar Demographics by Doctorate Degree
Demographics Similar to Australians by Doctorate Degree
In terms of doctorate degree, the demographic groups most similar to Australians are Immigrants from Norway (2.4%, a difference of 0.090%), Bulgarian (2.4%, a difference of 0.47%), Immigrants from Latvia (2.4%, a difference of 0.59%), Immigrants from Asia (2.4%, a difference of 1.2%), and Immigrants from Indonesia (2.4%, a difference of 1.3%).
| Demographics | Rating | Rank | Doctorate Degree |
| Immigrants | Netherlands | 100.0 /100 | #44 | Exceptional 2.5% |
| Immigrants | South Africa | 100.0 /100 | #45 | Exceptional 2.4% |
| Immigrants | Austria | 100.0 /100 | #46 | Exceptional 2.4% |
| Immigrants | Western Europe | 100.0 /100 | #47 | Exceptional 2.4% |
| Asians | 100.0 /100 | #48 | Exceptional 2.4% |
| Immigrants | Asia | 100.0 /100 | #49 | Exceptional 2.4% |
| Immigrants | Norway | 100.0 /100 | #50 | Exceptional 2.4% |
| Australians | 100.0 /100 | #51 | Exceptional 2.4% |
| Bulgarians | 100.0 /100 | #52 | Exceptional 2.4% |
| Immigrants | Latvia | 100.0 /100 | #53 | Exceptional 2.4% |
| Immigrants | Indonesia | 100.0 /100 | #54 | Exceptional 2.4% |
| Bolivians | 100.0 /100 | #55 | Exceptional 2.4% |
| Immigrants | Czechoslovakia | 100.0 /100 | #56 | Exceptional 2.4% |
| Immigrants | Ethiopia | 100.0 /100 | #57 | Exceptional 2.4% |
| Ethiopians | 99.9 /100 | #58 | Exceptional 2.3% |
Demographics Similar to Immigrants from Dominica by Doctorate Degree
In terms of doctorate degree, the demographic groups most similar to Immigrants from Dominica are Shoshone (1.4%, a difference of 0.030%), Mexican American Indian (1.4%, a difference of 0.060%), Pennsylvania German (1.4%, a difference of 0.19%), Guyanese (1.4%, a difference of 0.20%), and Honduran (1.4%, a difference of 0.36%).
| Demographics | Rating | Rank | Doctorate Degree |
| Immigrants | Ecuador | 0.2 /100 | #296 | Tragic 1.4% |
| Tsimshian | 0.2 /100 | #297 | Tragic 1.4% |
| Puerto Ricans | 0.1 /100 | #298 | Tragic 1.4% |
| Belizeans | 0.1 /100 | #299 | Tragic 1.4% |
| Immigrants | Guatemala | 0.1 /100 | #300 | Tragic 1.4% |
| Hondurans | 0.1 /100 | #301 | Tragic 1.4% |
| Shoshone | 0.1 /100 | #302 | Tragic 1.4% |
| Immigrants | Dominica | 0.1 /100 | #303 | Tragic 1.4% |
| Mexican American Indians | 0.1 /100 | #304 | Tragic 1.4% |
| Pennsylvania Germans | 0.1 /100 | #305 | Tragic 1.4% |
| Guyanese | 0.1 /100 | #306 | Tragic 1.4% |
| Cubans | 0.1 /100 | #307 | Tragic 1.4% |
| Immigrants | Laos | 0.1 /100 | #308 | Tragic 1.4% |
| Immigrants | Grenada | 0.1 /100 | #309 | Tragic 1.4% |
| Immigrants | Jamaica | 0.1 /100 | #310 | Tragic 1.4% |