Australian vs South African College, Under 1 year
COMPARE
Australian
South African
College, Under 1 year
College, Under 1 year Comparison
Australians
South Africans
70.4%
COLLEGE, UNDER 1 YEAR
99.9/ 100
METRIC RATING
38th/ 347
METRIC RANK
69.7%
COLLEGE, UNDER 1 YEAR
99.7/ 100
METRIC RATING
53rd/ 347
METRIC RANK
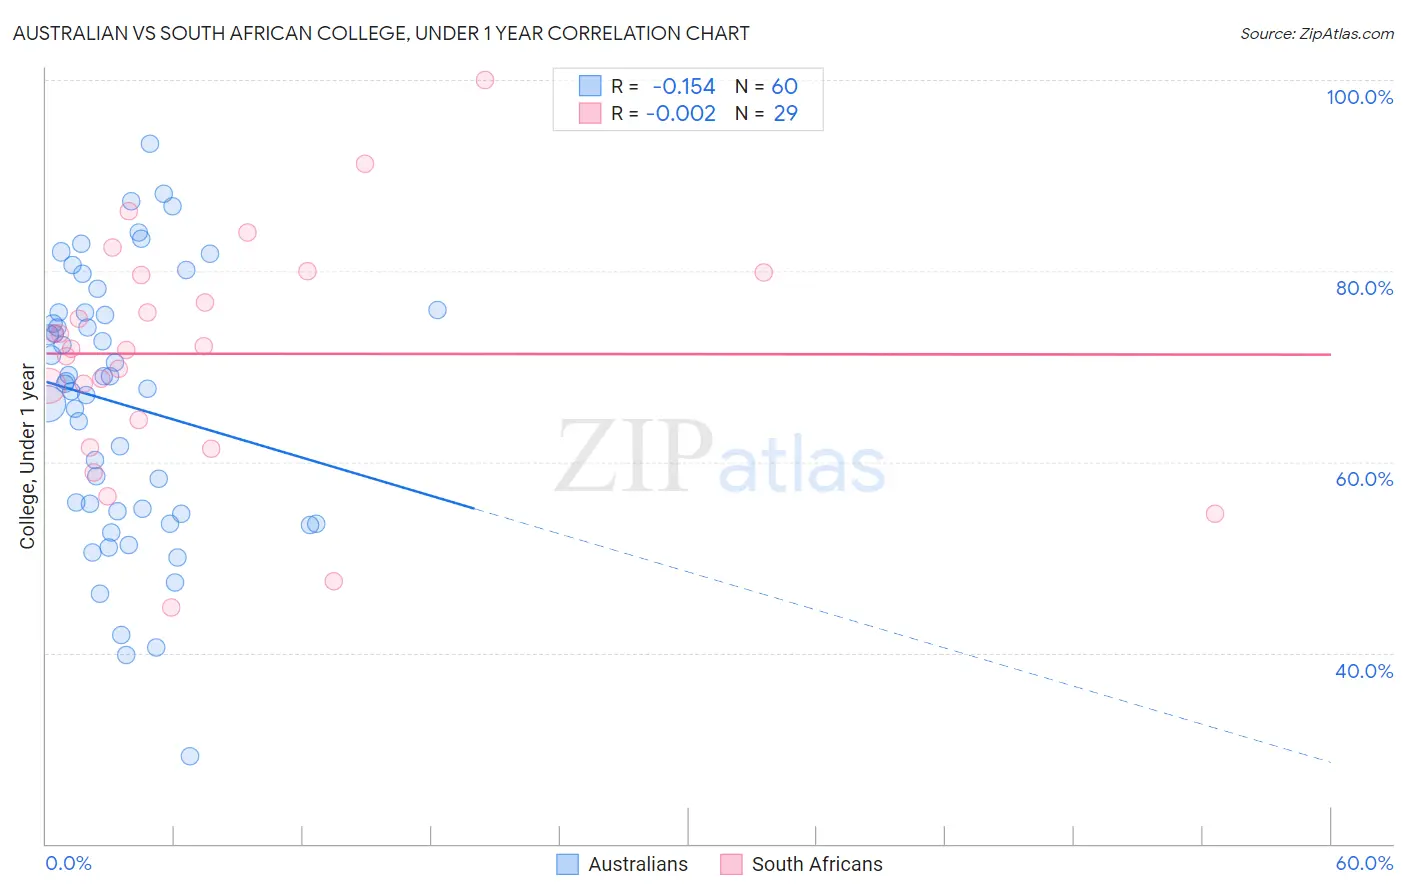
Australian vs South African College, Under 1 year Correlation Chart
The statistical analysis conducted on geographies consisting of 224,162,526 people shows a poor negative correlation between the proportion of Australians and percentage of population with at least college, under 1 year education in the United States with a correlation coefficient (R) of -0.154 and weighted average of 70.4%. Similarly, the statistical analysis conducted on geographies consisting of 182,603,987 people shows no correlation between the proportion of South Africans and percentage of population with at least college, under 1 year education in the United States with a correlation coefficient (R) of -0.002 and weighted average of 69.7%, a difference of 0.99%.
College, Under 1 year Correlation Summary
| Measurement | Australian | South African |
| Minimum | 29.1% | 44.7% |
| Maximum | 93.4% | 100.0% |
| Range | 64.2% | 55.3% |
| Mean | 66.0% | 71.3% |
| Median | 68.3% | 71.9% |
| Interquartile 25% (IQ1) | 54.7% | 62.9% |
| Interquartile 75% (IQ3) | 75.6% | 79.7% |
| Interquartile Range (IQR) | 21.0% | 16.7% |
| Standard Deviation (Sample) | 14.0% | 12.3% |
| Standard Deviation (Population) | 13.8% | 12.1% |
Demographics Similar to Australians and South Africans by College, Under 1 year
In terms of college, under 1 year, the demographic groups most similar to Australians are Bhutanese (70.3%, a difference of 0.020%), Immigrants from Turkey (70.3%, a difference of 0.030%), Immigrants from Saudi Arabia (70.4%, a difference of 0.070%), Immigrants from Kuwait (70.3%, a difference of 0.070%), and Immigrants from Lithuania (70.3%, a difference of 0.11%). Similarly, the demographic groups most similar to South Africans are Immigrants from Czechoslovakia (69.6%, a difference of 0.12%), Maltese (69.5%, a difference of 0.22%), Immigrants from Russia (69.9%, a difference of 0.27%), Mongolian (69.9%, a difference of 0.30%), and Zimbabwean (69.9%, a difference of 0.33%).
| Demographics | Rating | Rank | College, Under 1 year |
| Russians | 99.9 /100 | #35 | Exceptional 70.5% |
| Immigrants | Sri Lanka | 99.9 /100 | #36 | Exceptional 70.5% |
| Immigrants | Saudi Arabia | 99.9 /100 | #37 | Exceptional 70.4% |
| Australians | 99.9 /100 | #38 | Exceptional 70.4% |
| Bhutanese | 99.9 /100 | #39 | Exceptional 70.3% |
| Immigrants | Turkey | 99.9 /100 | #40 | Exceptional 70.3% |
| Immigrants | Kuwait | 99.9 /100 | #41 | Exceptional 70.3% |
| Immigrants | Lithuania | 99.9 /100 | #42 | Exceptional 70.3% |
| Israelis | 99.9 /100 | #43 | Exceptional 70.2% |
| New Zealanders | 99.9 /100 | #44 | Exceptional 70.2% |
| Immigrants | Norway | 99.9 /100 | #45 | Exceptional 70.2% |
| Immigrants | Latvia | 99.9 /100 | #46 | Exceptional 70.1% |
| Immigrants | Bulgaria | 99.8 /100 | #47 | Exceptional 70.0% |
| Immigrants | Netherlands | 99.8 /100 | #48 | Exceptional 70.0% |
| Immigrants | Austria | 99.8 /100 | #49 | Exceptional 70.0% |
| Zimbabweans | 99.8 /100 | #50 | Exceptional 69.9% |
| Mongolians | 99.8 /100 | #51 | Exceptional 69.9% |
| Immigrants | Russia | 99.8 /100 | #52 | Exceptional 69.9% |
| South Africans | 99.7 /100 | #53 | Exceptional 69.7% |
| Immigrants | Czechoslovakia | 99.7 /100 | #54 | Exceptional 69.6% |
| Maltese | 99.7 /100 | #55 | Exceptional 69.5% |