Immigrants from Ukraine vs Immigrants from Iran 3rd Grade

COMPARE

Immigrants from Ukraine
Race
Ancestry
AfghanAfricanAlaska NativeAlaskan AthabascanAlbanianAleutAlsatianAmericanApacheArabArapahoArgentineanArmenianAssyrian/Chaldean/SyriacAustralianAustrianBahamianBangladeshiBarbadianBasqueBelgianBelizeanBermudanBhutaneseBlackfeetBolivianBrazilianBritishBritish West IndianBulgarianBurmeseCajunCambodianCanadianCape VerdeanCarpatho RusynCelticCentral AmericanCentral American IndianCherokeeCheyenneChickasawChileanChineseChippewaChoctawColombianColvilleComancheCosta RicanCreeCreekCroatianCrowCubanCypriotCzechCzechoslovakianDanishDelawareDominicanDutchDutch West IndianEastern EuropeanEcuadorianEgyptianEnglishEstonianEthiopianEuropeanFijianFilipinoFinnishFrenchFrench American IndianFrench CanadianGermanGerman RussianGhanaianGreekGuamanian/ChamorroGuatemalanGuyaneseHaitianHmongHonduranHopiHoumaHungarianIcelanderIndian (Asian)IndonesianInupiatIranianIraqiIrishIroquoisIsraeliItalianJamaicanJapaneseJordanianKenyanKiowaKoreanLaotianLatvianLebaneseLiberianLithuanianLumbeeLuxembourgerMacedonianMalaysianMalteseMarshalleseMenomineeMexicanMexican American IndianMongolianMoroccanNative HawaiianNavajoNepaleseNew ZealanderNicaraguanNigerianNorthern EuropeanNorwegianOkinawanOsageOttawaPaiutePakistaniPalestinianPanamanianParaguayanPennsylvania GermanPeruvianPimaPolishPortuguesePotawatomiPuebloPuerto RicanPuget Sound SalishRomanianRussianSalvadoranSamoanScandinavianScotch-IrishScottishSeminoleSenegaleseSerbianShoshoneSierra LeoneanSiouxSlavicSlovakSloveneSomaliSouth AfricanSouth AmericanSouth American IndianSoviet UnionSpaniardSpanishSpanish AmericanSpanish American IndianSri LankanSubsaharan AfricanSudaneseSwedishSwissSyrianTaiwaneseThaiTlingit-HaidaTohono O'OdhamTonganTrinidadian and TobagonianTsimshianTurkishU.S. Virgin IslanderUgandanUkrainianUruguayanUteVenezuelanVietnameseWelshWest IndianYakamaYaquiYugoslavianYumanYup'ikZimbabwean
Immigration
NonimmigrantsImmigrantsAfghanistanAfricaAlbaniaArgentinaArmeniaAsiaAustraliaAustriaBahamasBangladeshBarbadosBelarusBelgiumBelizeBoliviaBosnia and HerzegovinaBrazilBulgariaBurma/MyanmarCabo VerdeCambodiaCameroonCanadaCaribbeanCentral AmericaChileChinaColombiaCongoCosta RicaCroatiaCubaCzechoslovakiaDenmarkDominicaDominican RepublicEastern AfricaEastern AsiaEastern EuropeEcuadorEgyptEl SalvadorEnglandEritreaEthiopiaEuropeFijiFranceGermanyGhanaGreeceGrenadaGuatemalaGuyanaHaitiHondurasHong KongHungaryIndiaIndonesiaIraqIrelandIsraelItalyJamaicaJapanJordanKazakhstanKenyaKoreaKuwaitLaosLatin AmericaLatviaLebanonLiberiaLithuaniaMalaysiaMexicoMicronesiaMiddle AfricaMoldovaMoroccoNepalNetherlandsNicaraguaNigeriaNorth AmericaNorth MacedoniaNorthern AfricaNorthern EuropeNorwayOceaniaPakistanPanamaPeruPhilippinesPolandPortugalRomaniaRussiaSaudi ArabiaScotlandSenegalSerbiaSierra LeoneSingaporeSomaliaSouth AfricaSouth AmericaSouth Central AsiaSouth Eastern AsiaSouthern EuropeSpainSri LankaSt. Vincent and the GrenadinesSudanSwedenSwitzerlandSyriaTaiwanThailandTrinidad and TobagoTurkeyUgandaUkraineUruguayUzbekistanVenezuelaVietnamWest IndiesWestern AfricaWestern AsiaWestern EuropeYemenZaireZimbabweAzores
Immigrants from Iran
Race
Ancestry
AfghanAfricanAlaska NativeAlaskan AthabascanAlbanianAleutAlsatianAmericanApacheArabArapahoArgentineanArmenianAssyrian/Chaldean/SyriacAustralianAustrianBahamianBangladeshiBarbadianBasqueBelgianBelizeanBermudanBhutaneseBlackfeetBolivianBrazilianBritishBritish West IndianBulgarianBurmeseCajunCambodianCanadianCape VerdeanCarpatho RusynCelticCentral AmericanCentral American IndianCherokeeCheyenneChickasawChileanChineseChippewaChoctawColombianColvilleComancheCosta RicanCreeCreekCroatianCrowCubanCypriotCzechCzechoslovakianDanishDelawareDominicanDutchDutch West IndianEastern EuropeanEcuadorianEgyptianEnglishEstonianEthiopianEuropeanFijianFilipinoFinnishFrenchFrench American IndianFrench CanadianGermanGerman RussianGhanaianGreekGuamanian/ChamorroGuatemalanGuyaneseHaitianHmongHonduranHopiHoumaHungarianIcelanderIndian (Asian)IndonesianInupiatIranianIraqiIrishIroquoisIsraeliItalianJamaicanJapaneseJordanianKenyanKiowaKoreanLaotianLatvianLebaneseLiberianLithuanianLumbeeLuxembourgerMacedonianMalaysianMalteseMarshalleseMenomineeMexicanMexican American IndianMongolianMoroccanNative HawaiianNavajoNepaleseNew ZealanderNicaraguanNigerianNorthern EuropeanNorwegianOkinawanOsageOttawaPaiutePakistaniPalestinianPanamanianParaguayanPennsylvania GermanPeruvianPimaPolishPortuguesePotawatomiPuebloPuerto RicanPuget Sound SalishRomanianRussianSalvadoranSamoanScandinavianScotch-IrishScottishSeminoleSenegaleseSerbianShoshoneSierra LeoneanSiouxSlavicSlovakSloveneSomaliSouth AfricanSouth AmericanSouth American IndianSoviet UnionSpaniardSpanishSpanish AmericanSpanish American IndianSri LankanSubsaharan AfricanSudaneseSwedishSwissSyrianTaiwaneseThaiTlingit-HaidaTohono O'OdhamTonganTrinidadian and TobagonianTsimshianTurkishU.S. Virgin IslanderUgandanUkrainianUruguayanUteVenezuelanVietnameseWelshWest IndianYakamaYaquiYugoslavianYumanYup'ikZimbabwean
Immigration
NonimmigrantsImmigrantsAfghanistanAfricaAlbaniaArgentinaArmeniaAsiaAustraliaAustriaBahamasBangladeshBarbadosBelarusBelgiumBelizeBoliviaBosnia and HerzegovinaBrazilBulgariaBurma/MyanmarCabo VerdeCambodiaCameroonCanadaCaribbeanCentral AmericaChileChinaColombiaCongoCosta RicaCroatiaCubaCzechoslovakiaDenmarkDominicaDominican RepublicEastern AfricaEastern AsiaEastern EuropeEcuadorEgyptEl SalvadorEnglandEritreaEthiopiaEuropeFijiFranceGermanyGhanaGreeceGrenadaGuatemalaGuyanaHaitiHondurasHong KongHungaryIndiaIndonesiaIranIraqIrelandIsraelItalyJamaicaJapanJordanKazakhstanKenyaKoreaKuwaitLaosLatin AmericaLatviaLebanonLiberiaLithuaniaMalaysiaMexicoMicronesiaMiddle AfricaMoldovaMoroccoNepalNetherlandsNicaraguaNigeriaNorth AmericaNorth MacedoniaNorthern AfricaNorthern EuropeNorwayOceaniaPakistanPanamaPeruPhilippinesPolandPortugalRomaniaRussiaSaudi ArabiaScotlandSenegalSerbiaSierra LeoneSingaporeSomaliaSouth AfricaSouth AmericaSouth Central AsiaSouth Eastern AsiaSouthern EuropeSpainSri LankaSt. Vincent and the GrenadinesSudanSwedenSwitzerlandSyriaTaiwanThailandTrinidad and TobagoTurkeyUgandaUruguayUzbekistanVenezuelaVietnamWest IndiesWestern AfricaWestern AsiaWestern EuropeYemenZaireZimbabweAzores
3rd Grade
Income
Poverty
Unemployment
Labor Participation
Family Structure
Vehicle Availability
Education Level
Disability

3rd Grade Comparison

Immigrants from Ukraine

Immigrants from Iran

Fair
Average
97.7%
3RD GRADE
22.7/ 100
METRIC RATING
199th/ 347
METRIC RANK
97.8%
3RD GRADE
59.1/ 100
METRIC RATING
160th/ 347
METRIC RANK

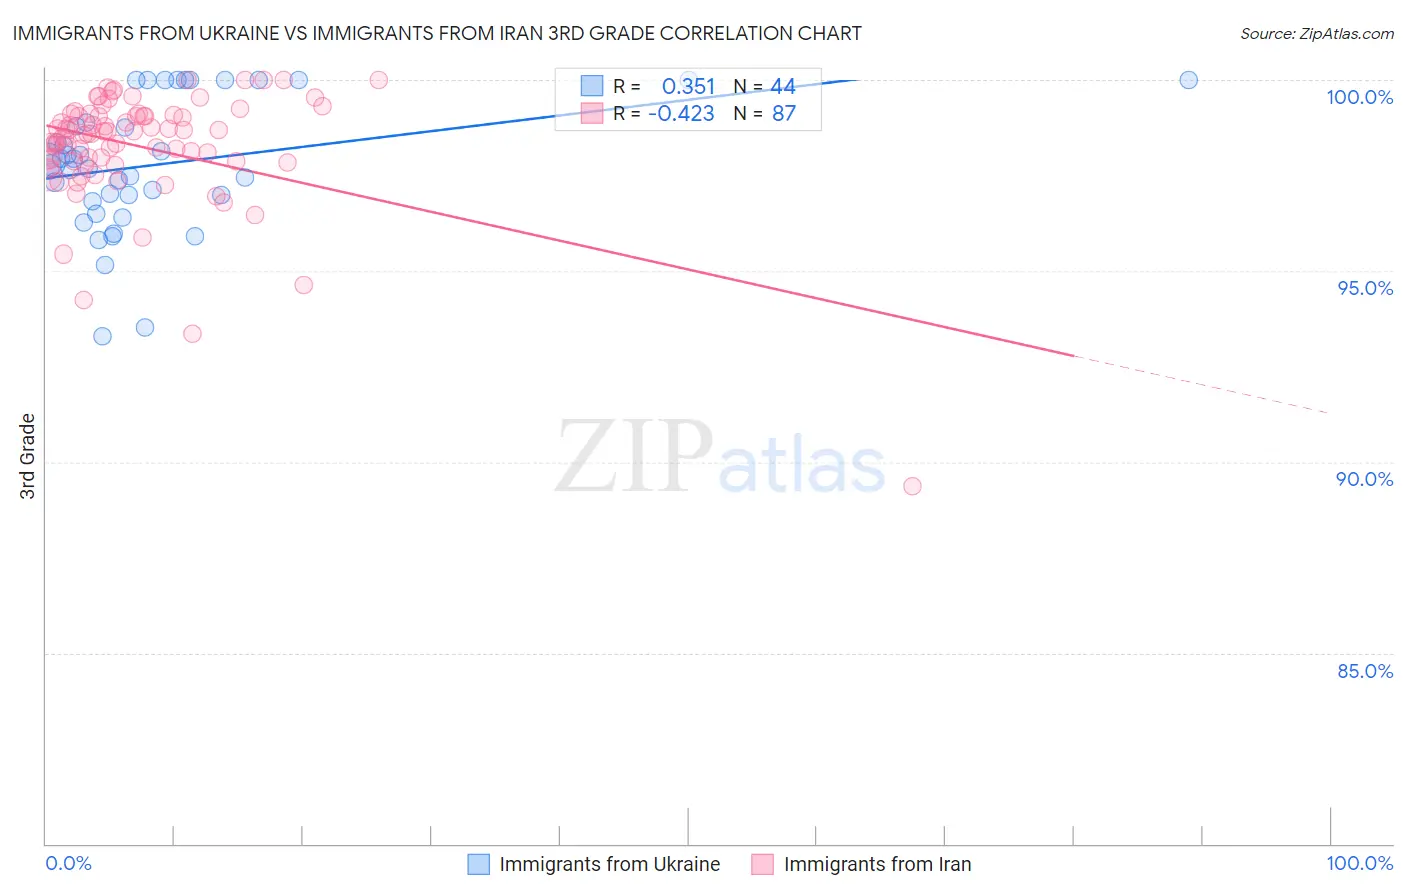
Immigrants from Ukraine vs Immigrants from Iran 3rd Grade Correlation Chart

The statistical analysis conducted on geographies consisting of 289,712,791 people shows a mild positive correlation between the proportion of Immigrants from Ukraine and percentage of population with at least 3rd grade education in the United States with a correlation coefficient (R) of 0.351 and weighted average of 97.7%. Similarly, the statistical analysis conducted on geographies consisting of 279,905,207 people shows a moderate negative correlation between the proportion of Immigrants from Iran and percentage of population with at least 3rd grade education in the United States with a correlation coefficient (R) of -0.423 and weighted average of 97.8%, a difference of 0.13%.
Immigrants from Ukraine vs Immigrants from Iran 3rd Grade

3rd Grade Correlation Summary

MeasurementImmigrants from UkraineImmigrants from Iran
Minimum93.3%89.4%
Maximum100.0%100.0%
Range6.7%10.6%
Mean97.8%98.3%
Median97.8%98.6%
Interquartile 25% (IQ1)96.9%97.9%
Interquartile 75% (IQ3)99.4%99.1%
Interquartile Range (IQR)2.6%1.2%
Standard Deviation (Sample)1.7%1.6%
Standard Deviation (Population)1.7%1.5%

Similar Demographics by 3rd Grade

Demographics Similar to Immigrants from Ukraine by 3rd Grade

In terms of 3rd grade, the demographic groups most similar to Immigrants from Ukraine are Guamanian/Chamorro (97.7%, a difference of 0.0%), Immigrants from Albania (97.7%, a difference of 0.0%), Hawaiian (97.7%, a difference of 0.010%), Immigrants from Lebanon (97.7%, a difference of 0.010%), and Immigrants from Kenya (97.7%, a difference of 0.020%).
DemographicsRating | Rank3rd Grade
Mongolians
29.1
/100
|
#192
Fair
97.7%
Immigrants | Kenya
28.2
/100
|
#193
Fair
97.7%
Immigrants | Uganda
27.4
/100
|
#194
Fair
97.7%
Immigrants | Egypt
26.8
/100
|
#195
Fair
97.7%
Paraguayans
26.2
/100
|
#196
Fair
97.7%
Hawaiians
25.7
/100
|
#197
Fair
97.7%
Guamanians/Chamorros
23.6
/100
|
#198
Fair
97.7%
Immigrants | Ukraine
22.7
/100
|
#199
Fair
97.7%
Immigrants | Albania
22.6
/100
|
#200
Fair
97.7%
Immigrants | Lebanon
21.7
/100
|
#201
Fair
97.7%
Immigrants | Southern Europe
17.7
/100
|
#202
Poor
97.6%
Paiute
16.7
/100
|
#203
Poor
97.6%
Immigrants | Chile
16.5
/100
|
#204
Poor
97.6%
Africans
14.5
/100
|
#205
Poor
97.6%
Immigrants | Northern Africa
13.0
/100
|
#206
Poor
97.6%

Demographics Similar to Immigrants from Iran by 3rd Grade

In terms of 3rd grade, the demographic groups most similar to Immigrants from Iran are French American Indian (97.8%, a difference of 0.0%), Albanian (97.8%, a difference of 0.0%), Immigrants from Jordan (97.8%, a difference of 0.0%), Bermudan (97.8%, a difference of 0.010%), and Immigrants from Russia (97.8%, a difference of 0.010%).
DemographicsRating | Rank3rd Grade
Apache
68.5
/100
|
#153
Good
97.8%
Immigrants | Eastern Europe
64.1
/100
|
#154
Good
97.8%
Bermudans
62.6
/100
|
#155
Good
97.8%
Immigrants | Russia
61.7
/100
|
#156
Good
97.8%
Immigrants | Italy
61.2
/100
|
#157
Good
97.8%
Venezuelans
60.9
/100
|
#158
Good
97.8%
French American Indians
60.0
/100
|
#159
Average
97.8%
Immigrants | Iran
59.1
/100
|
#160
Average
97.8%
Albanians
58.8
/100
|
#161
Average
97.8%
Immigrants | Jordan
57.9
/100
|
#162
Average
97.8%
Marshallese
57.2
/100
|
#163
Average
97.8%
Immigrants | Bosnia and Herzegovina
56.2
/100
|
#164
Average
97.8%
Ugandans
56.1
/100
|
#165
Average
97.8%
Dutch West Indians
55.5
/100
|
#166
Average
97.8%
Chileans
55.3
/100
|
#167
Average
97.8%