Assyrian/Chaldean/Syriac vs Vietnamese 3rd Grade
COMPARE
Assyrian/Chaldean/Syriac
Vietnamese
3rd Grade
3rd Grade Comparison
Assyrians/Chaldeans/Syriacs
Vietnamese
97.4%
3RD GRADE
1.0/ 100
METRIC RATING
247th/ 347
METRIC RANK
96.5%
3RD GRADE
0.0/ 100
METRIC RATING
319th/ 347
METRIC RANK
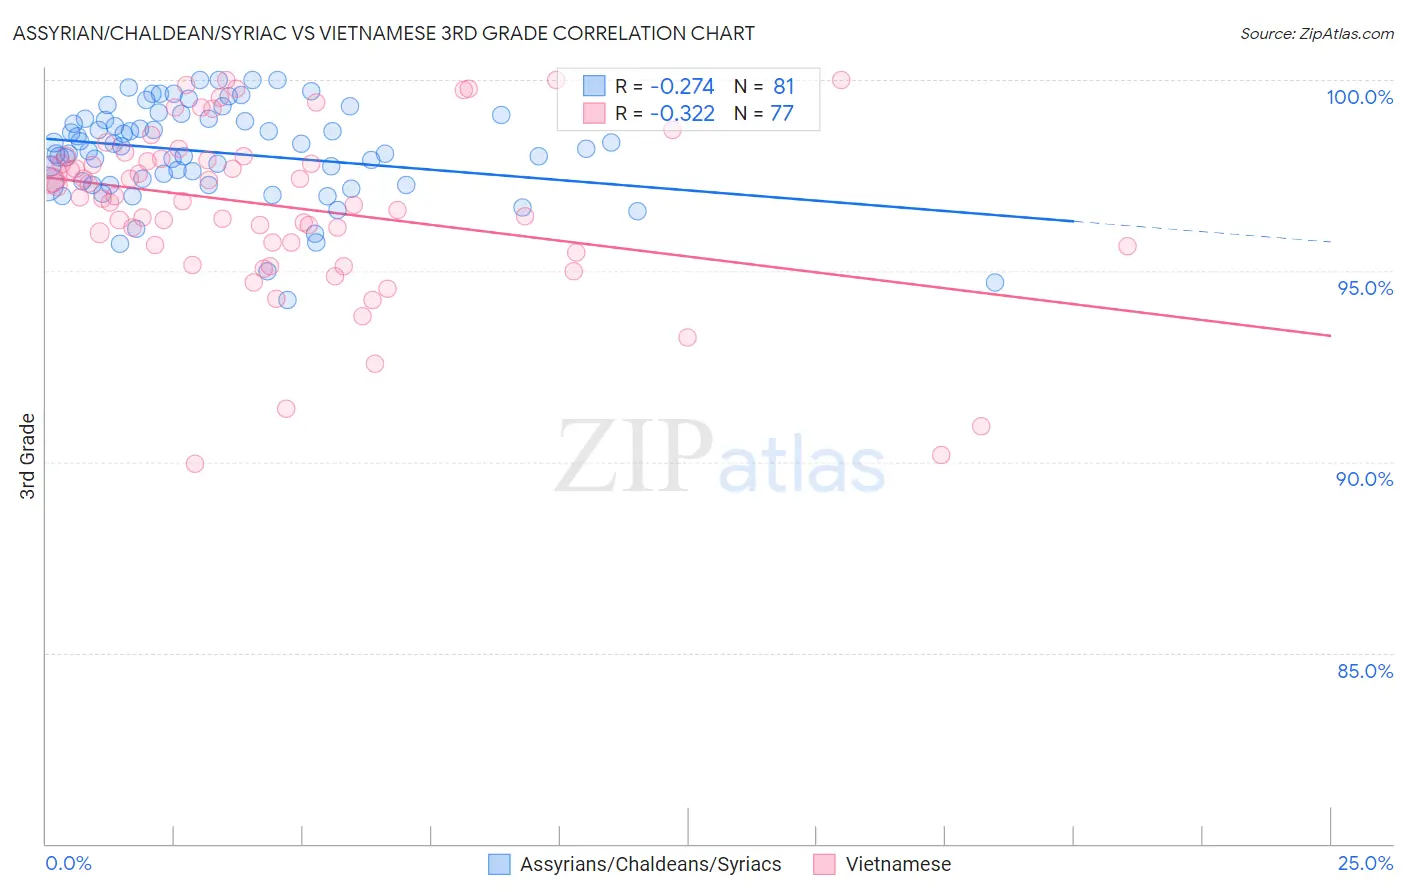
Assyrian/Chaldean/Syriac vs Vietnamese 3rd Grade Correlation Chart
The statistical analysis conducted on geographies consisting of 110,318,304 people shows a weak negative correlation between the proportion of Assyrians/Chaldeans/Syriacs and percentage of population with at least 3rd grade education in the United States with a correlation coefficient (R) of -0.274 and weighted average of 97.4%. Similarly, the statistical analysis conducted on geographies consisting of 170,752,104 people shows a mild negative correlation between the proportion of Vietnamese and percentage of population with at least 3rd grade education in the United States with a correlation coefficient (R) of -0.322 and weighted average of 96.5%, a difference of 0.89%.
3rd Grade Correlation Summary
| Measurement | Assyrian/Chaldean/Syriac | Vietnamese |
| Minimum | 94.2% | 89.9% |
| Maximum | 100.0% | 100.0% |
| Range | 5.8% | 10.1% |
| Mean | 98.1% | 96.7% |
| Median | 98.2% | 96.9% |
| Interquartile 25% (IQ1) | 97.3% | 95.7% |
| Interquartile 75% (IQ3) | 99.0% | 98.0% |
| Interquartile Range (IQR) | 1.7% | 2.3% |
| Standard Deviation (Sample) | 1.3% | 2.2% |
| Standard Deviation (Population) | 1.2% | 2.2% |
Similar Demographics by 3rd Grade
Demographics Similar to Assyrians/Chaldeans/Syriacs by 3rd Grade
In terms of 3rd grade, the demographic groups most similar to Assyrians/Chaldeans/Syriacs are Immigrants from Senegal (97.4%, a difference of 0.0%), Immigrants from Eastern Africa (97.4%, a difference of 0.0%), Asian (97.4%, a difference of 0.010%), Ethiopian (97.4%, a difference of 0.010%), and South American (97.4%, a difference of 0.010%).
| Demographics | Rating | Rank | 3rd Grade |
| U.S. Virgin Islanders | 1.4 /100 | #240 | Tragic 97.4% |
| Immigrants | Indonesia | 1.4 /100 | #241 | Tragic 97.4% |
| Koreans | 1.3 /100 | #242 | Tragic 97.4% |
| Indians (Asian) | 1.3 /100 | #243 | Tragic 97.4% |
| Asians | 1.1 /100 | #244 | Tragic 97.4% |
| Ethiopians | 1.1 /100 | #245 | Tragic 97.4% |
| Immigrants | Senegal | 1.0 /100 | #246 | Tragic 97.4% |
| Assyrians/Chaldeans/Syriacs | 1.0 /100 | #247 | Tragic 97.4% |
| Immigrants | Eastern Africa | 0.9 /100 | #248 | Tragic 97.4% |
| South Americans | 0.9 /100 | #249 | Tragic 97.4% |
| Immigrants | Middle Africa | 0.9 /100 | #250 | Tragic 97.4% |
| Immigrants | Asia | 0.8 /100 | #251 | Tragic 97.4% |
| Peruvians | 0.8 /100 | #252 | Tragic 97.4% |
| Immigrants | Africa | 0.8 /100 | #253 | Tragic 97.4% |
| Jamaicans | 0.7 /100 | #254 | Tragic 97.4% |
Demographics Similar to Vietnamese by 3rd Grade
In terms of 3rd grade, the demographic groups most similar to Vietnamese are Hispanic or Latino (96.5%, a difference of 0.010%), Immigrants from Nicaragua (96.5%, a difference of 0.010%), Indonesian (96.5%, a difference of 0.010%), Immigrants from Belize (96.5%, a difference of 0.020%), and Immigrants from Bangladesh (96.6%, a difference of 0.040%).
| Demographics | Rating | Rank | 3rd Grade |
| Immigrants | Laos | 0.0 /100 | #312 | Tragic 96.6% |
| Immigrants | Ecuador | 0.0 /100 | #313 | Tragic 96.6% |
| Belizeans | 0.0 /100 | #314 | Tragic 96.6% |
| Immigrants | Azores | 0.0 /100 | #315 | Tragic 96.6% |
| Immigrants | Burma/Myanmar | 0.0 /100 | #316 | Tragic 96.6% |
| Immigrants | Bangladesh | 0.0 /100 | #317 | Tragic 96.6% |
| Hispanics or Latinos | 0.0 /100 | #318 | Tragic 96.5% |
| Vietnamese | 0.0 /100 | #319 | Tragic 96.5% |
| Immigrants | Nicaragua | 0.0 /100 | #320 | Tragic 96.5% |
| Indonesians | 0.0 /100 | #321 | Tragic 96.5% |
| Immigrants | Belize | 0.0 /100 | #322 | Tragic 96.5% |
| Hondurans | 0.0 /100 | #323 | Tragic 96.5% |
| Dominicans | 0.0 /100 | #324 | Tragic 96.4% |
| Mexican American Indians | 0.0 /100 | #325 | Tragic 96.4% |
| Immigrants | Vietnam | 0.0 /100 | #326 | Tragic 96.4% |