Czechoslovakian vs Immigrants from Iran 3rd Grade
COMPARE
Czechoslovakian
Immigrants from Iran
3rd Grade
3rd Grade Comparison
Czechoslovakians
Immigrants from Iran
98.3%
3RD GRADE
99.8/ 100
METRIC RATING
47th/ 347
METRIC RANK
97.8%
3RD GRADE
59.1/ 100
METRIC RATING
160th/ 347
METRIC RANK
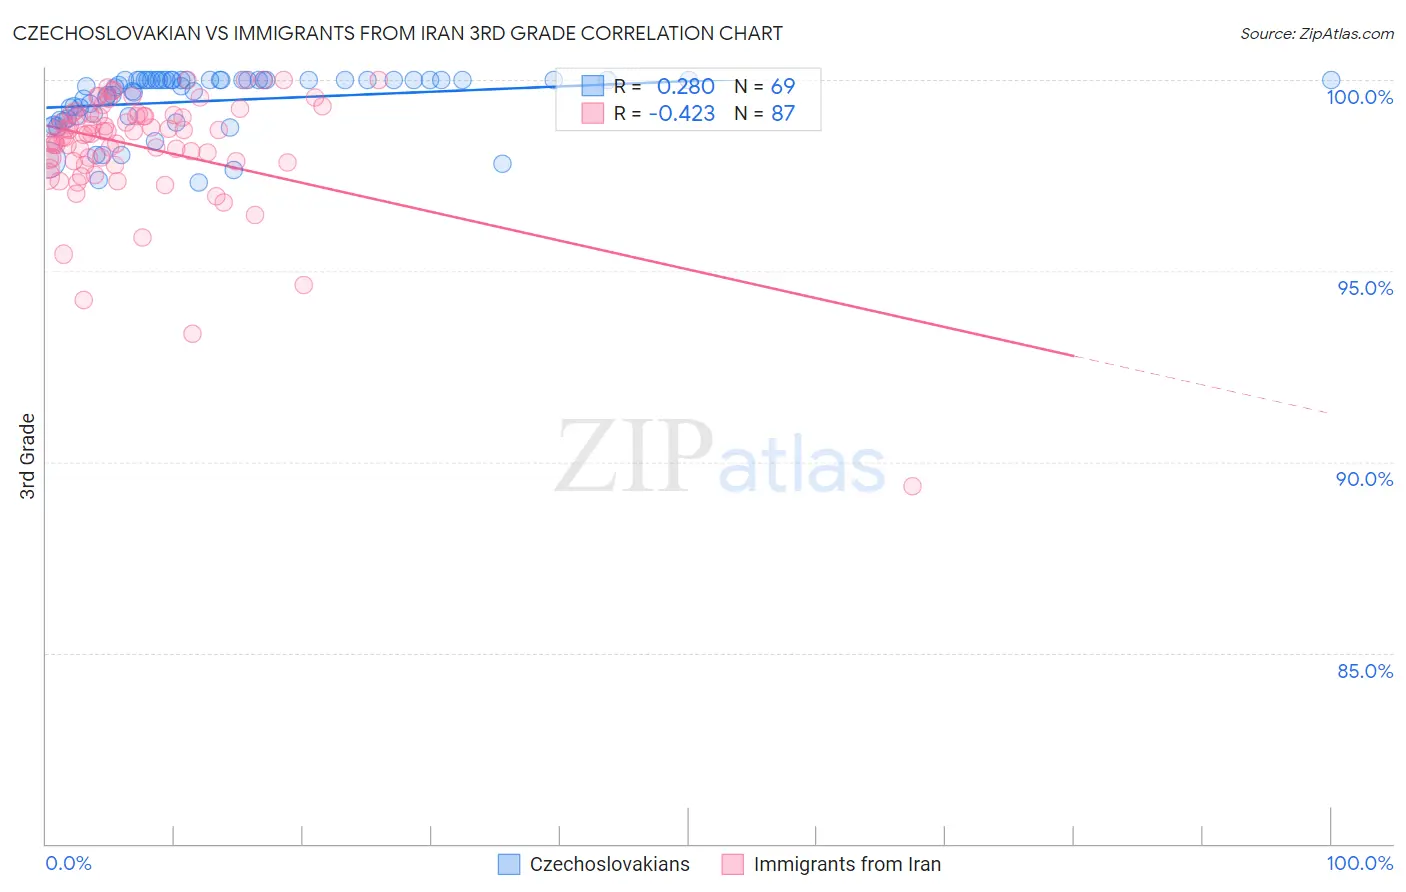
Czechoslovakian vs Immigrants from Iran 3rd Grade Correlation Chart
The statistical analysis conducted on geographies consisting of 368,668,876 people shows a weak positive correlation between the proportion of Czechoslovakians and percentage of population with at least 3rd grade education in the United States with a correlation coefficient (R) of 0.280 and weighted average of 98.3%. Similarly, the statistical analysis conducted on geographies consisting of 279,905,207 people shows a moderate negative correlation between the proportion of Immigrants from Iran and percentage of population with at least 3rd grade education in the United States with a correlation coefficient (R) of -0.423 and weighted average of 97.8%, a difference of 0.51%.
3rd Grade Correlation Summary
| Measurement | Czechoslovakian | Immigrants from Iran |
| Minimum | 97.3% | 89.4% |
| Maximum | 100.0% | 100.0% |
| Range | 2.7% | 10.6% |
| Mean | 99.5% | 98.3% |
| Median | 99.9% | 98.6% |
| Interquartile 25% (IQ1) | 99.0% | 97.9% |
| Interquartile 75% (IQ3) | 100.0% | 99.1% |
| Interquartile Range (IQR) | 0.98% | 1.2% |
| Standard Deviation (Sample) | 0.76% | 1.6% |
| Standard Deviation (Population) | 0.75% | 1.5% |
Similar Demographics by 3rd Grade
Demographics Similar to Czechoslovakians by 3rd Grade
In terms of 3rd grade, the demographic groups most similar to Czechoslovakians are Ottawa (98.3%, a difference of 0.0%), Lumbee (98.3%, a difference of 0.0%), Estonian (98.3%, a difference of 0.020%), Celtic (98.3%, a difference of 0.020%), and Australian (98.3%, a difference of 0.020%).
| Demographics | Rating | Rank | 3rd Grade |
| Eastern Europeans | 99.9 /100 | #40 | Exceptional 98.3% |
| Luxembourgers | 99.9 /100 | #41 | Exceptional 98.3% |
| Belgians | 99.9 /100 | #42 | Exceptional 98.3% |
| Northern Europeans | 99.9 /100 | #43 | Exceptional 98.3% |
| Hungarians | 99.9 /100 | #44 | Exceptional 98.3% |
| Native Hawaiians | 99.9 /100 | #45 | Exceptional 98.3% |
| Ottawa | 99.8 /100 | #46 | Exceptional 98.3% |
| Czechoslovakians | 99.8 /100 | #47 | Exceptional 98.3% |
| Lumbee | 99.8 /100 | #48 | Exceptional 98.3% |
| Estonians | 99.8 /100 | #49 | Exceptional 98.3% |
| Celtics | 99.8 /100 | #50 | Exceptional 98.3% |
| Australians | 99.8 /100 | #51 | Exceptional 98.3% |
| Whites/Caucasians | 99.8 /100 | #52 | Exceptional 98.3% |
| Immigrants | Scotland | 99.8 /100 | #53 | Exceptional 98.3% |
| Bulgarians | 99.8 /100 | #54 | Exceptional 98.3% |
Demographics Similar to Immigrants from Iran by 3rd Grade
In terms of 3rd grade, the demographic groups most similar to Immigrants from Iran are French American Indian (97.8%, a difference of 0.0%), Albanian (97.8%, a difference of 0.0%), Immigrants from Jordan (97.8%, a difference of 0.0%), Bermudan (97.8%, a difference of 0.010%), and Immigrants from Russia (97.8%, a difference of 0.010%).
| Demographics | Rating | Rank | 3rd Grade |
| Apache | 68.5 /100 | #153 | Good 97.8% |
| Immigrants | Eastern Europe | 64.1 /100 | #154 | Good 97.8% |
| Bermudans | 62.6 /100 | #155 | Good 97.8% |
| Immigrants | Russia | 61.7 /100 | #156 | Good 97.8% |
| Immigrants | Italy | 61.2 /100 | #157 | Good 97.8% |
| Venezuelans | 60.9 /100 | #158 | Good 97.8% |
| French American Indians | 60.0 /100 | #159 | Average 97.8% |
| Immigrants | Iran | 59.1 /100 | #160 | Average 97.8% |
| Albanians | 58.8 /100 | #161 | Average 97.8% |
| Immigrants | Jordan | 57.9 /100 | #162 | Average 97.8% |
| Marshallese | 57.2 /100 | #163 | Average 97.8% |
| Immigrants | Bosnia and Herzegovina | 56.2 /100 | #164 | Average 97.8% |
| Ugandans | 56.1 /100 | #165 | Average 97.8% |
| Dutch West Indians | 55.5 /100 | #166 | Average 97.8% |
| Chileans | 55.3 /100 | #167 | Average 97.8% |