Assyrian/Chaldean/Syriac vs Immigrants from Italy 4th Grade
COMPARE
Assyrian/Chaldean/Syriac
Immigrants from Italy
4th Grade
4th Grade Comparison
Assyrians/Chaldeans/Syriacs
Immigrants from Italy
97.2%
4TH GRADE
3.0/ 100
METRIC RATING
234th/ 347
METRIC RANK
97.6%
4TH GRADE
63.7/ 100
METRIC RATING
159th/ 347
METRIC RANK
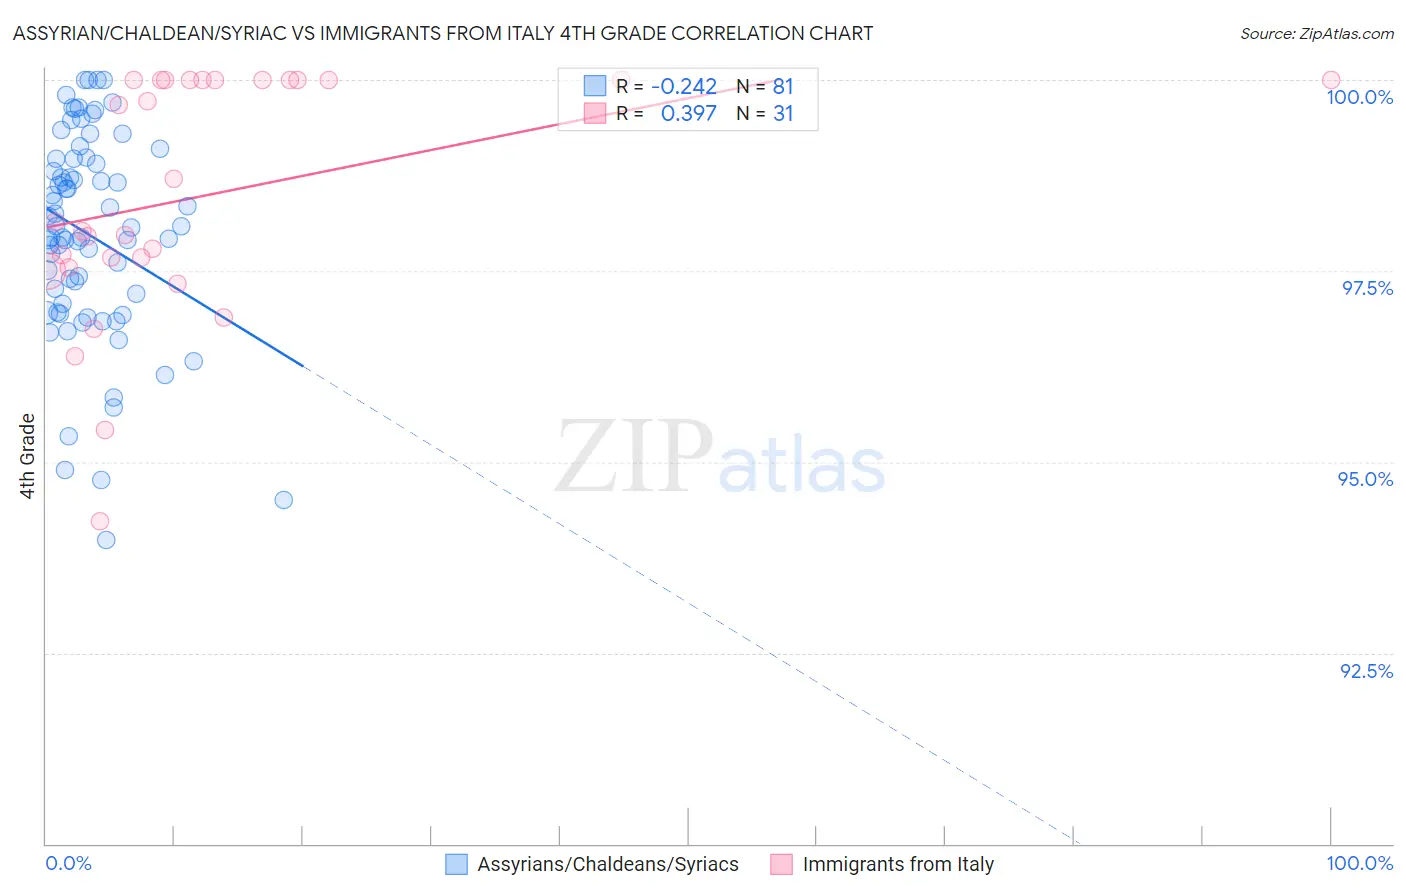
Assyrian/Chaldean/Syriac vs Immigrants from Italy 4th Grade Correlation Chart
The statistical analysis conducted on geographies consisting of 110,318,304 people shows a weak negative correlation between the proportion of Assyrians/Chaldeans/Syriacs and percentage of population with at least 4th grade education in the United States with a correlation coefficient (R) of -0.242 and weighted average of 97.2%. Similarly, the statistical analysis conducted on geographies consisting of 324,225,917 people shows a mild positive correlation between the proportion of Immigrants from Italy and percentage of population with at least 4th grade education in the United States with a correlation coefficient (R) of 0.397 and weighted average of 97.6%, a difference of 0.38%.
4th Grade Correlation Summary
| Measurement | Assyrian/Chaldean/Syriac | Immigrants from Italy |
| Minimum | 94.0% | 94.2% |
| Maximum | 100.0% | 100.0% |
| Range | 6.0% | 5.8% |
| Mean | 98.0% | 98.5% |
| Median | 98.1% | 98.1% |
| Interquartile 25% (IQ1) | 97.0% | 97.5% |
| Interquartile 75% (IQ3) | 99.0% | 100.0% |
| Interquartile Range (IQR) | 2.0% | 2.5% |
| Standard Deviation (Sample) | 1.4% | 1.6% |
| Standard Deviation (Population) | 1.3% | 1.6% |
Similar Demographics by 4th Grade
Demographics Similar to Assyrians/Chaldeans/Syriacs by 4th Grade
In terms of 4th grade, the demographic groups most similar to Assyrians/Chaldeans/Syriacs are Senegalese (97.2%, a difference of 0.0%), Yuman (97.2%, a difference of 0.0%), Immigrants from Malaysia (97.2%, a difference of 0.010%), Immigrants from Western Asia (97.2%, a difference of 0.010%), and Immigrants from Eastern Asia (97.2%, a difference of 0.010%).
| Demographics | Rating | Rank | 4th Grade |
| Immigrants | Pakistan | 3.7 /100 | #227 | Tragic 97.2% |
| Sub-Saharan Africans | 3.6 /100 | #228 | Tragic 97.2% |
| Liberians | 3.6 /100 | #229 | Tragic 97.2% |
| Uruguayans | 3.5 /100 | #230 | Tragic 97.2% |
| Immigrants | Malaysia | 3.4 /100 | #231 | Tragic 97.2% |
| Immigrants | Western Asia | 3.4 /100 | #232 | Tragic 97.2% |
| Senegalese | 3.1 /100 | #233 | Tragic 97.2% |
| Assyrians/Chaldeans/Syriacs | 3.0 /100 | #234 | Tragic 97.2% |
| Yuman | 2.9 /100 | #235 | Tragic 97.2% |
| Immigrants | Eastern Asia | 2.7 /100 | #236 | Tragic 97.2% |
| Immigrants | Costa Rica | 2.0 /100 | #237 | Tragic 97.2% |
| Indians (Asian) | 1.9 /100 | #238 | Tragic 97.2% |
| Nigerians | 1.8 /100 | #239 | Tragic 97.1% |
| Colombians | 1.6 /100 | #240 | Tragic 97.1% |
| Immigrants | Indonesia | 1.5 /100 | #241 | Tragic 97.1% |
Demographics Similar to Immigrants from Italy by 4th Grade
In terms of 4th grade, the demographic groups most similar to Immigrants from Italy are Immigrants from Russia (97.6%, a difference of 0.010%), Albanian (97.6%, a difference of 0.010%), Immigrants from Jordan (97.6%, a difference of 0.010%), Immigrants from Bosnia and Herzegovina (97.6%, a difference of 0.010%), and French American Indian (97.6%, a difference of 0.010%).
| Demographics | Rating | Rank | 4th Grade |
| Immigrants | South Central Asia | 76.2 /100 | #152 | Good 97.6% |
| Immigrants | Eastern Europe | 71.3 /100 | #153 | Good 97.6% |
| Immigrants | Russia | 67.0 /100 | #154 | Good 97.6% |
| Albanians | 67.0 /100 | #155 | Good 97.6% |
| Immigrants | Jordan | 66.9 /100 | #156 | Good 97.6% |
| Immigrants | Bosnia and Herzegovina | 66.0 /100 | #157 | Good 97.6% |
| French American Indians | 65.9 /100 | #158 | Good 97.6% |
| Immigrants | Italy | 63.7 /100 | #159 | Good 97.6% |
| Apache | 61.3 /100 | #160 | Good 97.6% |
| Marshallese | 60.8 /100 | #161 | Good 97.6% |
| Bermudans | 60.5 /100 | #162 | Good 97.6% |
| Immigrants | Iran | 60.3 /100 | #163 | Good 97.6% |
| Ugandans | 58.9 /100 | #164 | Average 97.6% |
| Venezuelans | 58.7 /100 | #165 | Average 97.6% |
| Kenyans | 56.5 /100 | #166 | Average 97.5% |