U.S. Virgin Islander vs Immigrants from Congo 4th Grade
COMPARE
U.S. Virgin Islander
Immigrants from Congo
4th Grade
4th Grade Comparison
U.S. Virgin Islanders
Immigrants from Congo
97.1%
4TH GRADE
1.4/ 100
METRIC RATING
243rd/ 347
METRIC RANK
97.0%
4TH GRADE
0.5/ 100
METRIC RATING
257th/ 347
METRIC RANK
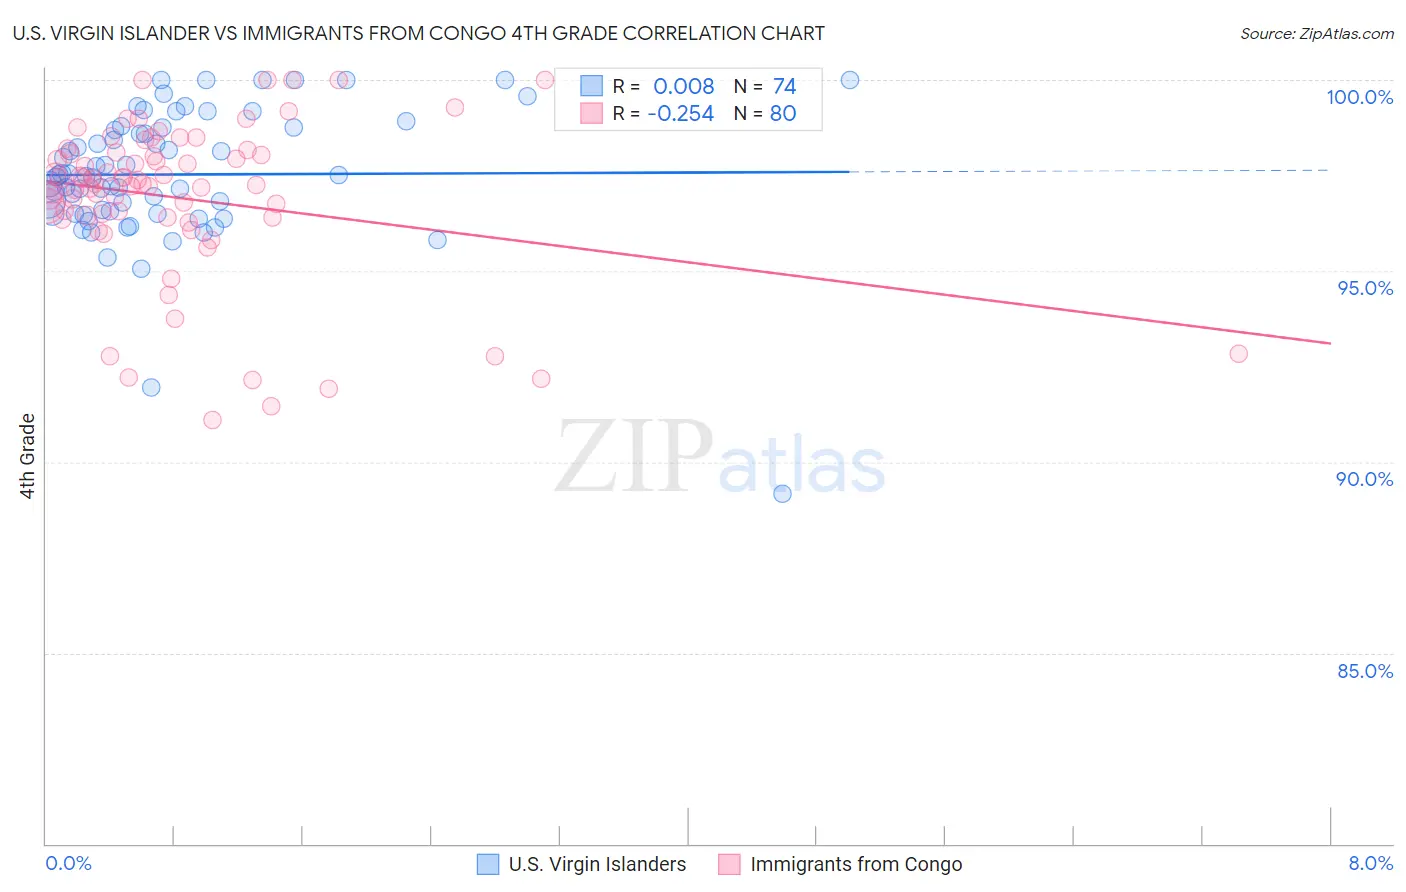
U.S. Virgin Islander vs Immigrants from Congo 4th Grade Correlation Chart
The statistical analysis conducted on geographies consisting of 87,529,315 people shows no correlation between the proportion of U.S. Virgin Islanders and percentage of population with at least 4th grade education in the United States with a correlation coefficient (R) of 0.008 and weighted average of 97.1%. Similarly, the statistical analysis conducted on geographies consisting of 92,124,753 people shows a weak negative correlation between the proportion of Immigrants from Congo and percentage of population with at least 4th grade education in the United States with a correlation coefficient (R) of -0.254 and weighted average of 97.0%, a difference of 0.10%.
4th Grade Correlation Summary
| Measurement | U.S. Virgin Islander | Immigrants from Congo |
| Minimum | 89.2% | 91.1% |
| Maximum | 100.0% | 100.0% |
| Range | 10.8% | 8.9% |
| Mean | 97.5% | 96.9% |
| Median | 97.5% | 97.3% |
| Interquartile 25% (IQ1) | 96.5% | 96.4% |
| Interquartile 75% (IQ3) | 98.7% | 98.1% |
| Interquartile Range (IQR) | 2.2% | 1.7% |
| Standard Deviation (Sample) | 1.8% | 2.1% |
| Standard Deviation (Population) | 1.8% | 2.1% |
Demographics Similar to U.S. Virgin Islanders and Immigrants from Congo by 4th Grade
In terms of 4th grade, the demographic groups most similar to U.S. Virgin Islanders are Asian (97.1%, a difference of 0.0%), Immigrants from Indonesia (97.1%, a difference of 0.010%), Korean (97.1%, a difference of 0.010%), Immigrants from Eastern Africa (97.1%, a difference of 0.010%), and Immigrants from Uruguay (97.1%, a difference of 0.010%). Similarly, the demographic groups most similar to Immigrants from Congo are Immigrants from Colombia (97.0%, a difference of 0.0%), Immigrants from Ethiopia (97.0%, a difference of 0.010%), Immigrants from Sierra Leone (97.0%, a difference of 0.020%), Peruvian (97.1%, a difference of 0.040%), and Bolivian (97.1%, a difference of 0.040%).
| Demographics | Rating | Rank | 4th Grade |
| Colombians | 1.6 /100 | #240 | Tragic 97.1% |
| Immigrants | Indonesia | 1.5 /100 | #241 | Tragic 97.1% |
| Asians | 1.4 /100 | #242 | Tragic 97.1% |
| U.S. Virgin Islanders | 1.4 /100 | #243 | Tragic 97.1% |
| Koreans | 1.3 /100 | #244 | Tragic 97.1% |
| Immigrants | Eastern Africa | 1.2 /100 | #245 | Tragic 97.1% |
| Immigrants | Uruguay | 1.2 /100 | #246 | Tragic 97.1% |
| Ethiopians | 1.2 /100 | #247 | Tragic 97.1% |
| Immigrants | Asia | 1.2 /100 | #248 | Tragic 97.1% |
| Immigrants | Africa | 1.0 /100 | #249 | Tragic 97.1% |
| Immigrants | Senegal | 0.9 /100 | #250 | Tragic 97.1% |
| South Americans | 0.8 /100 | #251 | Tragic 97.1% |
| Jamaicans | 0.8 /100 | #252 | Tragic 97.1% |
| Immigrants | Liberia | 0.8 /100 | #253 | Tragic 97.1% |
| Immigrants | Middle Africa | 0.8 /100 | #254 | Tragic 97.1% |
| Peruvians | 0.7 /100 | #255 | Tragic 97.1% |
| Bolivians | 0.7 /100 | #256 | Tragic 97.1% |
| Immigrants | Congo | 0.5 /100 | #257 | Tragic 97.0% |
| Immigrants | Colombia | 0.5 /100 | #258 | Tragic 97.0% |
| Immigrants | Ethiopia | 0.4 /100 | #259 | Tragic 97.0% |
| Immigrants | Sierra Leone | 0.4 /100 | #260 | Tragic 97.0% |