Assyrian/Chaldean/Syriac vs Asian 2nd Grade
COMPARE
Assyrian/Chaldean/Syriac
Asian
2nd Grade
2nd Grade Comparison
Assyrians/Chaldeans/Syriacs
Asians
97.5%
2ND GRADE
0.5/ 100
METRIC RATING
260th/ 347
METRIC RANK
97.5%
2ND GRADE
1.1/ 100
METRIC RATING
243rd/ 347
METRIC RANK
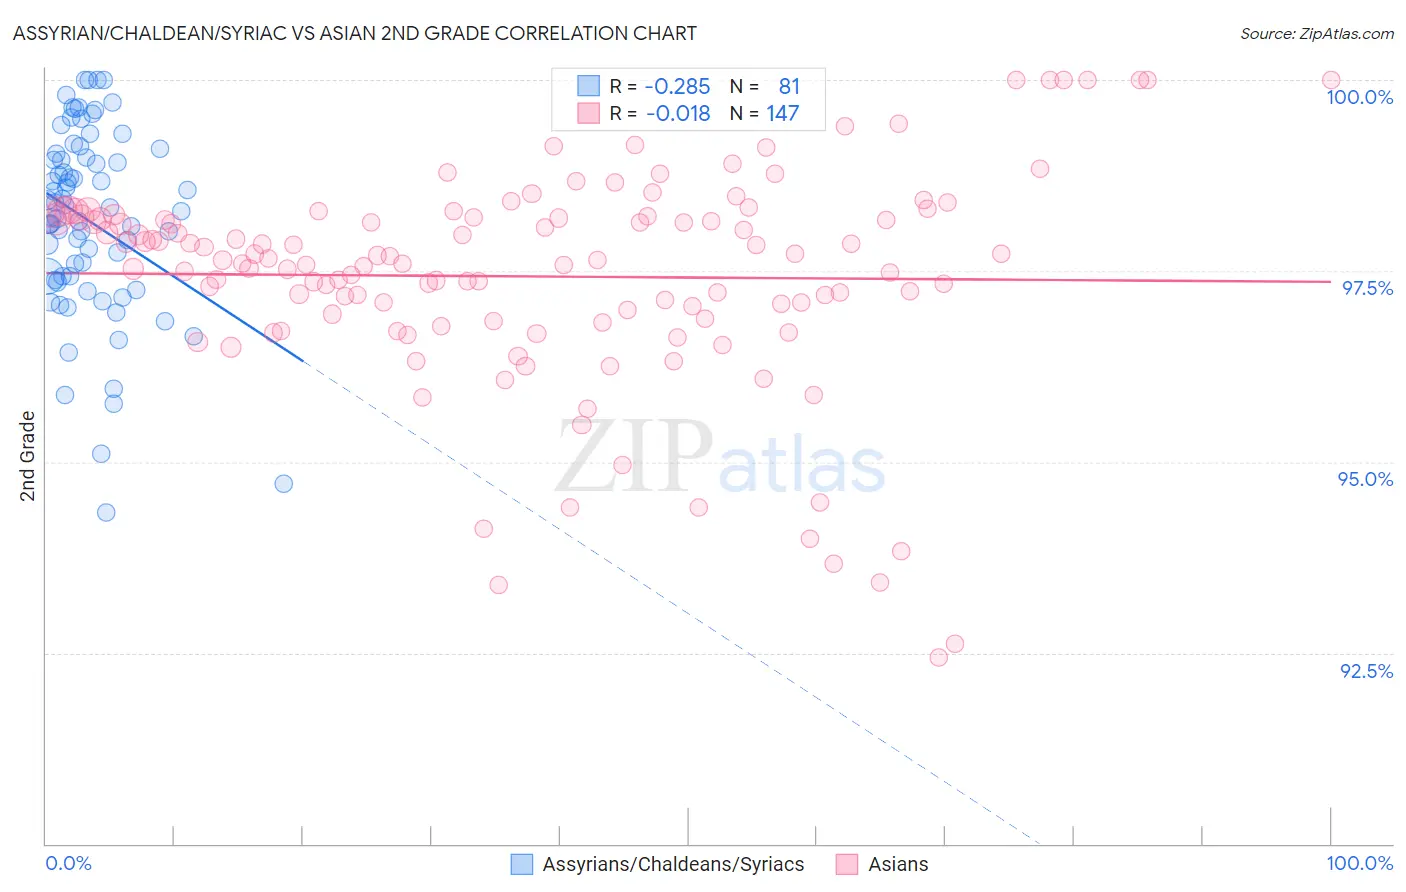
Assyrian/Chaldean/Syriac vs Asian 2nd Grade Correlation Chart
The statistical analysis conducted on geographies consisting of 110,318,304 people shows a weak negative correlation between the proportion of Assyrians/Chaldeans/Syriacs and percentage of population with at least 2nd grade education in the United States with a correlation coefficient (R) of -0.285 and weighted average of 97.5%. Similarly, the statistical analysis conducted on geographies consisting of 550,722,447 people shows no correlation between the proportion of Asians and percentage of population with at least 2nd grade education in the United States with a correlation coefficient (R) of -0.018 and weighted average of 97.5%, a difference of 0.070%.
2nd Grade Correlation Summary
| Measurement | Assyrian/Chaldean/Syriac | Asian |
| Minimum | 94.3% | 92.4% |
| Maximum | 100.0% | 100.0% |
| Range | 5.7% | 7.6% |
| Mean | 98.2% | 97.4% |
| Median | 98.3% | 97.6% |
| Interquartile 25% (IQ1) | 97.4% | 96.9% |
| Interquartile 75% (IQ3) | 99.0% | 98.2% |
| Interquartile Range (IQR) | 1.6% | 1.3% |
| Standard Deviation (Sample) | 1.2% | 1.4% |
| Standard Deviation (Population) | 1.2% | 1.4% |
Demographics Similar to Assyrians/Chaldeans/Syriacs and Asians by 2nd Grade
In terms of 2nd grade, the demographic groups most similar to Assyrians/Chaldeans/Syriacs are Fijian (97.5%, a difference of 0.0%), Armenian (97.5%, a difference of 0.0%), Immigrants from Colombia (97.5%, a difference of 0.010%), Yaqui (97.5%, a difference of 0.010%), and Indian (Asian) (97.5%, a difference of 0.020%). Similarly, the demographic groups most similar to Asians are Ethiopian (97.5%, a difference of 0.010%), Immigrants from Indonesia (97.5%, a difference of 0.010%), Immigrants from Iraq (97.5%, a difference of 0.010%), Immigrants from Eastern Africa (97.5%, a difference of 0.010%), and South American (97.5%, a difference of 0.020%).
| Demographics | Rating | Rank | 2nd Grade |
| Ethiopians | 1.2 /100 | #241 | Tragic 97.5% |
| Immigrants | Indonesia | 1.2 /100 | #242 | Tragic 97.5% |
| Asians | 1.1 /100 | #243 | Tragic 97.5% |
| Immigrants | Iraq | 1.0 /100 | #244 | Tragic 97.5% |
| Immigrants | Eastern Africa | 0.9 /100 | #245 | Tragic 97.5% |
| South Americans | 0.9 /100 | #246 | Tragic 97.5% |
| Immigrants | Senegal | 0.9 /100 | #247 | Tragic 97.5% |
| Immigrants | Middle Africa | 0.9 /100 | #248 | Tragic 97.5% |
| Bolivians | 0.9 /100 | #249 | Tragic 97.5% |
| Peruvians | 0.9 /100 | #250 | Tragic 97.5% |
| Immigrants | Africa | 0.8 /100 | #251 | Tragic 97.5% |
| Immigrants | Asia | 0.7 /100 | #252 | Tragic 97.5% |
| Puerto Ricans | 0.7 /100 | #253 | Tragic 97.5% |
| Indians (Asian) | 0.6 /100 | #254 | Tragic 97.5% |
| Immigrants | Congo | 0.6 /100 | #255 | Tragic 97.5% |
| Jamaicans | 0.6 /100 | #256 | Tragic 97.5% |
| Immigrants | Colombia | 0.5 /100 | #257 | Tragic 97.5% |
| Yaqui | 0.5 /100 | #258 | Tragic 97.5% |
| Fijians | 0.5 /100 | #259 | Tragic 97.5% |
| Assyrians/Chaldeans/Syriacs | 0.5 /100 | #260 | Tragic 97.5% |
| Armenians | 0.5 /100 | #261 | Tragic 97.5% |