Assyrian/Chaldean/Syriac vs Immigrants from Uganda 2nd Grade
COMPARE
Assyrian/Chaldean/Syriac
Immigrants from Uganda
2nd Grade
2nd Grade Comparison
Assyrians/Chaldeans/Syriacs
Immigrants from Uganda
97.5%
2ND GRADE
0.5/ 100
METRIC RATING
260th/ 347
METRIC RANK
97.8%
2ND GRADE
26.3/ 100
METRIC RATING
197th/ 347
METRIC RANK
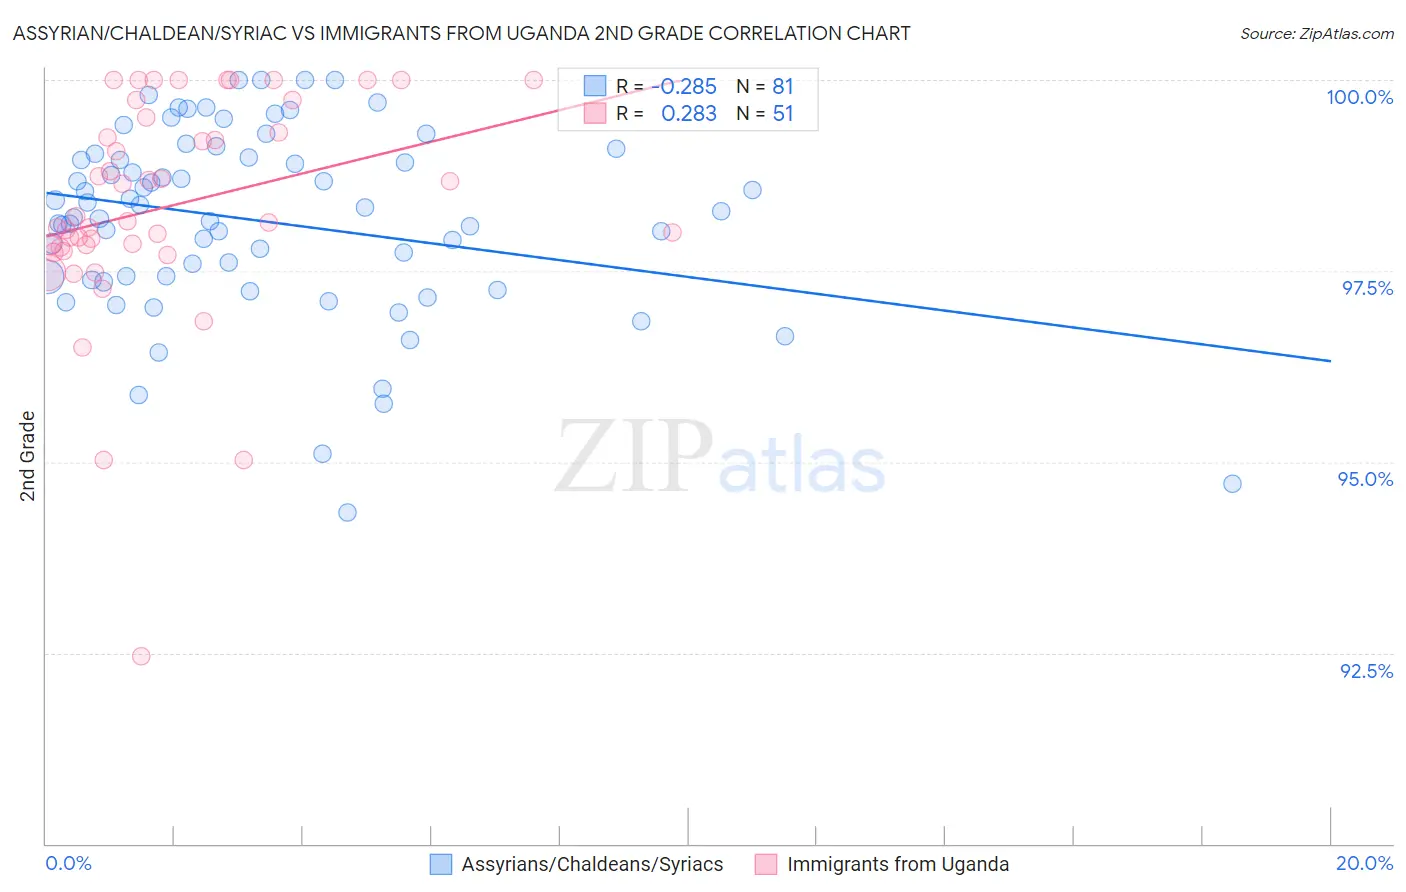
Assyrian/Chaldean/Syriac vs Immigrants from Uganda 2nd Grade Correlation Chart
The statistical analysis conducted on geographies consisting of 110,318,304 people shows a weak negative correlation between the proportion of Assyrians/Chaldeans/Syriacs and percentage of population with at least 2nd grade education in the United States with a correlation coefficient (R) of -0.285 and weighted average of 97.5%. Similarly, the statistical analysis conducted on geographies consisting of 125,908,537 people shows a weak positive correlation between the proportion of Immigrants from Uganda and percentage of population with at least 2nd grade education in the United States with a correlation coefficient (R) of 0.283 and weighted average of 97.8%, a difference of 0.34%.
2nd Grade Correlation Summary
| Measurement | Assyrian/Chaldean/Syriac | Immigrants from Uganda |
| Minimum | 94.3% | 92.5% |
| Maximum | 100.0% | 100.0% |
| Range | 5.7% | 7.5% |
| Mean | 98.2% | 98.3% |
| Median | 98.3% | 98.2% |
| Interquartile 25% (IQ1) | 97.4% | 97.8% |
| Interquartile 75% (IQ3) | 99.0% | 99.5% |
| Interquartile Range (IQR) | 1.6% | 1.7% |
| Standard Deviation (Sample) | 1.2% | 1.5% |
| Standard Deviation (Population) | 1.2% | 1.4% |
Similar Demographics by 2nd Grade
Demographics Similar to Assyrians/Chaldeans/Syriacs by 2nd Grade
In terms of 2nd grade, the demographic groups most similar to Assyrians/Chaldeans/Syriacs are Fijian (97.5%, a difference of 0.0%), Armenian (97.5%, a difference of 0.0%), Immigrants from Colombia (97.5%, a difference of 0.010%), Yaqui (97.5%, a difference of 0.010%), and Taiwanese (97.4%, a difference of 0.010%).
| Demographics | Rating | Rank | 2nd Grade |
| Puerto Ricans | 0.7 /100 | #253 | Tragic 97.5% |
| Indians (Asian) | 0.6 /100 | #254 | Tragic 97.5% |
| Immigrants | Congo | 0.6 /100 | #255 | Tragic 97.5% |
| Jamaicans | 0.6 /100 | #256 | Tragic 97.5% |
| Immigrants | Colombia | 0.5 /100 | #257 | Tragic 97.5% |
| Yaqui | 0.5 /100 | #258 | Tragic 97.5% |
| Fijians | 0.5 /100 | #259 | Tragic 97.5% |
| Assyrians/Chaldeans/Syriacs | 0.5 /100 | #260 | Tragic 97.5% |
| Armenians | 0.5 /100 | #261 | Tragic 97.5% |
| Taiwanese | 0.4 /100 | #262 | Tragic 97.4% |
| Immigrants | Ethiopia | 0.4 /100 | #263 | Tragic 97.4% |
| Immigrants | Liberia | 0.4 /100 | #264 | Tragic 97.4% |
| Immigrants | South America | 0.4 /100 | #265 | Tragic 97.4% |
| Immigrants | Sierra Leone | 0.4 /100 | #266 | Tragic 97.4% |
| Cubans | 0.3 /100 | #267 | Tragic 97.4% |
Demographics Similar to Immigrants from Uganda by 2nd Grade
In terms of 2nd grade, the demographic groups most similar to Immigrants from Uganda are Paiute (97.8%, a difference of 0.0%), Mongolian (97.8%, a difference of 0.0%), Immigrants from Kenya (97.8%, a difference of 0.0%), Guamanian/Chamorro (97.8%, a difference of 0.0%), and Black/African American (97.8%, a difference of 0.010%).
| Demographics | Rating | Rank | 2nd Grade |
| Immigrants | Taiwan | 31.8 /100 | #190 | Fair 97.8% |
| Paraguayans | 30.8 /100 | #191 | Fair 97.8% |
| Blacks/African Americans | 29.9 /100 | #192 | Fair 97.8% |
| Hawaiians | 28.5 /100 | #193 | Fair 97.8% |
| Paiute | 27.0 /100 | #194 | Fair 97.8% |
| Mongolians | 26.7 /100 | #195 | Fair 97.8% |
| Immigrants | Kenya | 26.4 /100 | #196 | Fair 97.8% |
| Immigrants | Uganda | 26.3 /100 | #197 | Fair 97.8% |
| Guamanians/Chamorros | 25.7 /100 | #198 | Fair 97.8% |
| Immigrants | Egypt | 24.4 /100 | #199 | Fair 97.8% |
| Immigrants | Lebanon | 20.9 /100 | #200 | Fair 97.8% |
| Tohono O'odham | 20.9 /100 | #201 | Fair 97.8% |
| Immigrants | Ukraine | 20.5 /100 | #202 | Fair 97.8% |
| Yuman | 20.0 /100 | #203 | Fair 97.8% |
| Immigrants | Albania | 18.4 /100 | #204 | Poor 97.8% |