Turkish vs Croatian High School Diploma
COMPARE
Turkish
Croatian
High School Diploma
High School Diploma Comparison
Turks
Croatians
91.2%
HIGH SCHOOL DIPLOMA
99.8/ 100
METRIC RATING
45th/ 347
METRIC RANK
92.0%
HIGH SCHOOL DIPLOMA
100.0/ 100
METRIC RATING
10th/ 347
METRIC RANK
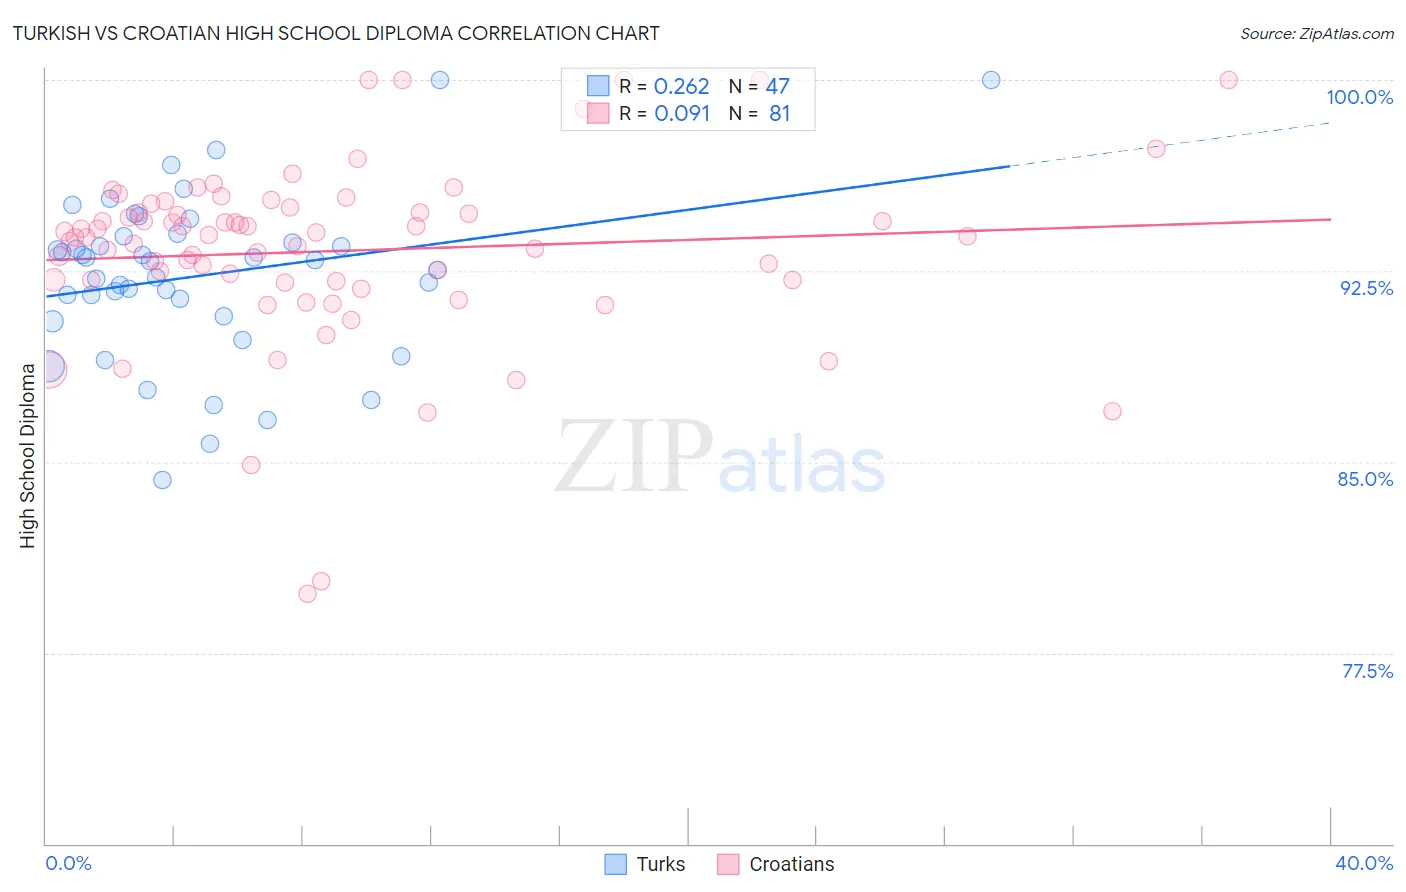
Turkish vs Croatian High School Diploma Correlation Chart
The statistical analysis conducted on geographies consisting of 271,864,133 people shows a weak positive correlation between the proportion of Turks and percentage of population with at least high school diploma education in the United States with a correlation coefficient (R) of 0.262 and weighted average of 91.2%. Similarly, the statistical analysis conducted on geographies consisting of 375,733,787 people shows a slight positive correlation between the proportion of Croatians and percentage of population with at least high school diploma education in the United States with a correlation coefficient (R) of 0.091 and weighted average of 92.0%, a difference of 0.78%.
High School Diploma Correlation Summary
| Measurement | Turkish | Croatian |
| Minimum | 84.3% | 79.8% |
| Maximum | 100.0% | 100.0% |
| Range | 15.7% | 20.2% |
| Mean | 92.3% | 93.3% |
| Median | 92.9% | 93.9% |
| Interquartile 25% (IQ1) | 90.7% | 92.1% |
| Interquartile 75% (IQ3) | 93.8% | 94.9% |
| Interquartile Range (IQR) | 3.1% | 2.8% |
| Standard Deviation (Sample) | 3.2% | 3.6% |
| Standard Deviation (Population) | 3.2% | 3.6% |
Similar Demographics by High School Diploma
Demographics Similar to Turks by High School Diploma
In terms of high school diploma, the demographic groups most similar to Turks are Immigrants from Austria (91.3%, a difference of 0.0%), Northern European (91.3%, a difference of 0.020%), British (91.3%, a difference of 0.020%), Immigrants from Australia (91.3%, a difference of 0.030%), and Greek (91.2%, a difference of 0.030%).
| Demographics | Rating | Rank | High School Diploma |
| Immigrants | Scotland | 99.8 /100 | #38 | Exceptional 91.3% |
| Dutch | 99.8 /100 | #39 | Exceptional 91.3% |
| Immigrants | Lithuania | 99.8 /100 | #40 | Exceptional 91.3% |
| Immigrants | Australia | 99.8 /100 | #41 | Exceptional 91.3% |
| Northern Europeans | 99.8 /100 | #42 | Exceptional 91.3% |
| British | 99.8 /100 | #43 | Exceptional 91.3% |
| Immigrants | Austria | 99.8 /100 | #44 | Exceptional 91.3% |
| Turks | 99.8 /100 | #45 | Exceptional 91.2% |
| Greeks | 99.8 /100 | #46 | Exceptional 91.2% |
| Australians | 99.8 /100 | #47 | Exceptional 91.2% |
| Belgians | 99.8 /100 | #48 | Exceptional 91.2% |
| Bhutanese | 99.8 /100 | #49 | Exceptional 91.2% |
| Welsh | 99.8 /100 | #50 | Exceptional 91.2% |
| New Zealanders | 99.7 /100 | #51 | Exceptional 91.1% |
| Immigrants | Sweden | 99.7 /100 | #52 | Exceptional 91.1% |
Demographics Similar to Croatians by High School Diploma
In terms of high school diploma, the demographic groups most similar to Croatians are Latvian (92.0%, a difference of 0.030%), Chinese (92.0%, a difference of 0.050%), Slovak (92.0%, a difference of 0.060%), Immigrants from India (92.0%, a difference of 0.060%), and Eastern European (91.9%, a difference of 0.070%).
| Demographics | Rating | Rank | High School Diploma |
| Carpatho Rusyns | 100.0 /100 | #3 | Exceptional 92.1% |
| Lithuanians | 100.0 /100 | #4 | Exceptional 92.0% |
| Slovenes | 100.0 /100 | #5 | Exceptional 92.0% |
| Slovaks | 100.0 /100 | #6 | Exceptional 92.0% |
| Immigrants | India | 100.0 /100 | #7 | Exceptional 92.0% |
| Chinese | 100.0 /100 | #8 | Exceptional 92.0% |
| Latvians | 100.0 /100 | #9 | Exceptional 92.0% |
| Croatians | 100.0 /100 | #10 | Exceptional 92.0% |
| Eastern Europeans | 100.0 /100 | #11 | Exceptional 91.9% |
| Poles | 100.0 /100 | #12 | Exceptional 91.9% |
| Danes | 100.0 /100 | #13 | Exceptional 91.8% |
| Bulgarians | 100.0 /100 | #14 | Exceptional 91.8% |
| Luxembourgers | 100.0 /100 | #15 | Exceptional 91.7% |
| Finns | 100.0 /100 | #16 | Exceptional 91.7% |
| Immigrants | Singapore | 99.9 /100 | #17 | Exceptional 91.7% |