Immigrants from Singapore vs Croatian High School Diploma
COMPARE
Immigrants from Singapore
Croatian
High School Diploma
High School Diploma Comparison
Immigrants from Singapore
Croatians
91.7%
HIGH SCHOOL DIPLOMA
99.9/ 100
METRIC RATING
17th/ 347
METRIC RANK
92.0%
HIGH SCHOOL DIPLOMA
100.0/ 100
METRIC RATING
10th/ 347
METRIC RANK
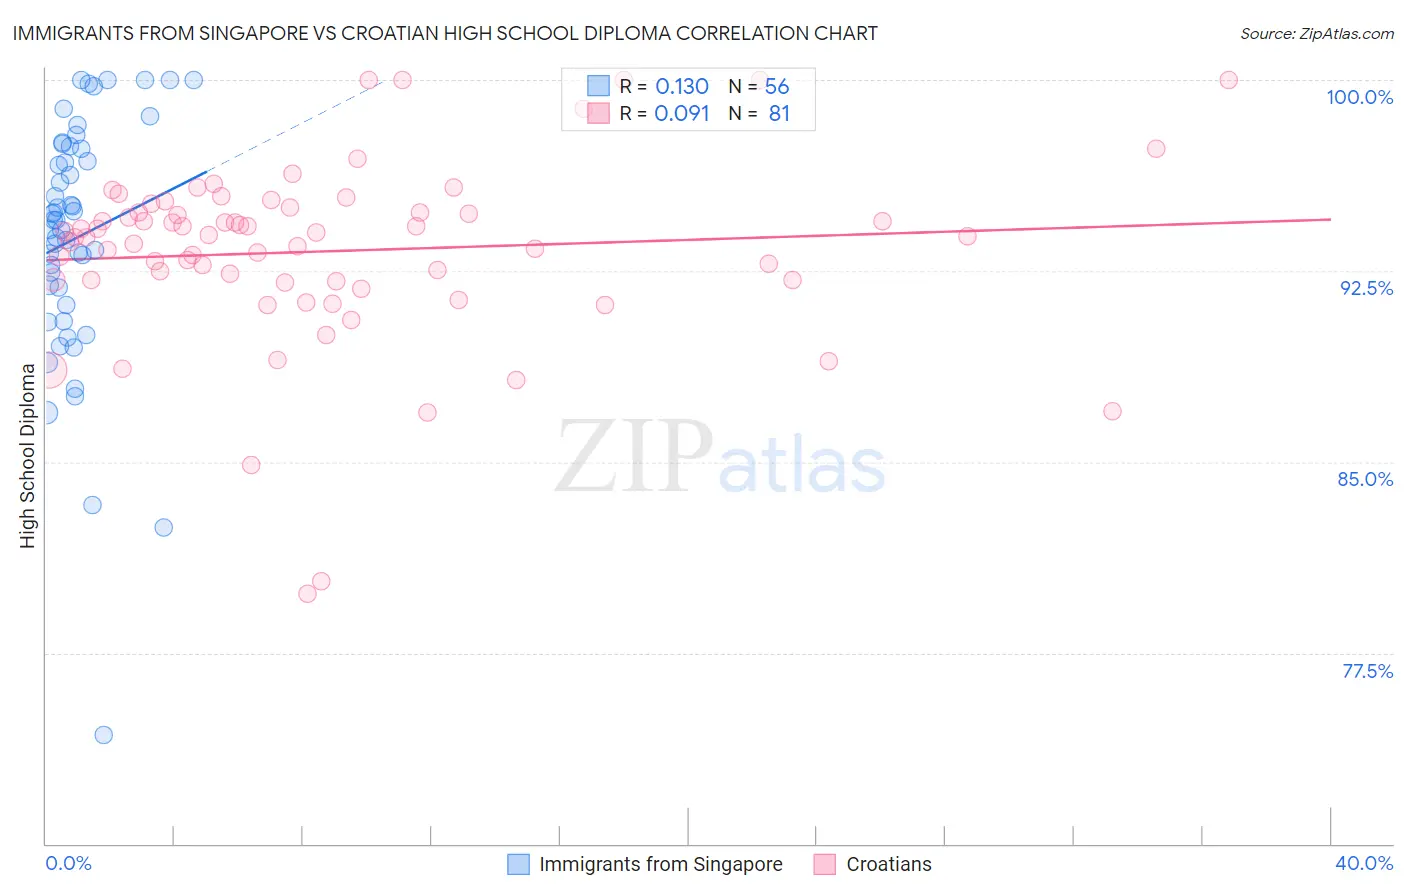
Immigrants from Singapore vs Croatian High School Diploma Correlation Chart
The statistical analysis conducted on geographies consisting of 137,521,094 people shows a poor positive correlation between the proportion of Immigrants from Singapore and percentage of population with at least high school diploma education in the United States with a correlation coefficient (R) of 0.130 and weighted average of 91.7%. Similarly, the statistical analysis conducted on geographies consisting of 375,733,787 people shows a slight positive correlation between the proportion of Croatians and percentage of population with at least high school diploma education in the United States with a correlation coefficient (R) of 0.091 and weighted average of 92.0%, a difference of 0.30%.
High School Diploma Correlation Summary
| Measurement | Immigrants from Singapore | Croatian |
| Minimum | 74.3% | 79.8% |
| Maximum | 100.0% | 100.0% |
| Range | 25.7% | 20.2% |
| Mean | 93.8% | 93.3% |
| Median | 94.5% | 93.9% |
| Interquartile 25% (IQ1) | 91.5% | 92.1% |
| Interquartile 75% (IQ3) | 97.3% | 94.9% |
| Interquartile Range (IQR) | 5.8% | 2.8% |
| Standard Deviation (Sample) | 4.9% | 3.6% |
| Standard Deviation (Population) | 4.9% | 3.6% |
Demographics Similar to Immigrants from Singapore and Croatians by High School Diploma
In terms of high school diploma, the demographic groups most similar to Immigrants from Singapore are German (91.7%, a difference of 0.010%), Finnish (91.7%, a difference of 0.040%), Luxembourger (91.7%, a difference of 0.060%), Maltese (91.6%, a difference of 0.080%), and Bulgarian (91.8%, a difference of 0.090%). Similarly, the demographic groups most similar to Croatians are Latvian (92.0%, a difference of 0.030%), Chinese (92.0%, a difference of 0.050%), Slovak (92.0%, a difference of 0.060%), Immigrants from India (92.0%, a difference of 0.060%), and Eastern European (91.9%, a difference of 0.070%).
| Demographics | Rating | Rank | High School Diploma |
| Carpatho Rusyns | 100.0 /100 | #3 | Exceptional 92.1% |
| Lithuanians | 100.0 /100 | #4 | Exceptional 92.0% |
| Slovenes | 100.0 /100 | #5 | Exceptional 92.0% |
| Slovaks | 100.0 /100 | #6 | Exceptional 92.0% |
| Immigrants | India | 100.0 /100 | #7 | Exceptional 92.0% |
| Chinese | 100.0 /100 | #8 | Exceptional 92.0% |
| Latvians | 100.0 /100 | #9 | Exceptional 92.0% |
| Croatians | 100.0 /100 | #10 | Exceptional 92.0% |
| Eastern Europeans | 100.0 /100 | #11 | Exceptional 91.9% |
| Poles | 100.0 /100 | #12 | Exceptional 91.9% |
| Danes | 100.0 /100 | #13 | Exceptional 91.8% |
| Bulgarians | 100.0 /100 | #14 | Exceptional 91.8% |
| Luxembourgers | 100.0 /100 | #15 | Exceptional 91.7% |
| Finns | 100.0 /100 | #16 | Exceptional 91.7% |
| Immigrants | Singapore | 99.9 /100 | #17 | Exceptional 91.7% |
| Germans | 99.9 /100 | #18 | Exceptional 91.7% |
| Maltese | 99.9 /100 | #19 | Exceptional 91.6% |
| Czechs | 99.9 /100 | #20 | Exceptional 91.6% |
| Filipinos | 99.9 /100 | #21 | Exceptional 91.6% |
| Estonians | 99.9 /100 | #22 | Exceptional 91.6% |
| Scandinavians | 99.9 /100 | #23 | Exceptional 91.5% |