Immigrants from Guatemala vs Croatian High School Diploma
COMPARE
Immigrants from Guatemala
Croatian
High School Diploma
High School Diploma Comparison
Immigrants from Guatemala
Croatians
81.4%
HIGH SCHOOL DIPLOMA
0.0/ 100
METRIC RATING
342nd/ 347
METRIC RANK
92.0%
HIGH SCHOOL DIPLOMA
100.0/ 100
METRIC RATING
10th/ 347
METRIC RANK
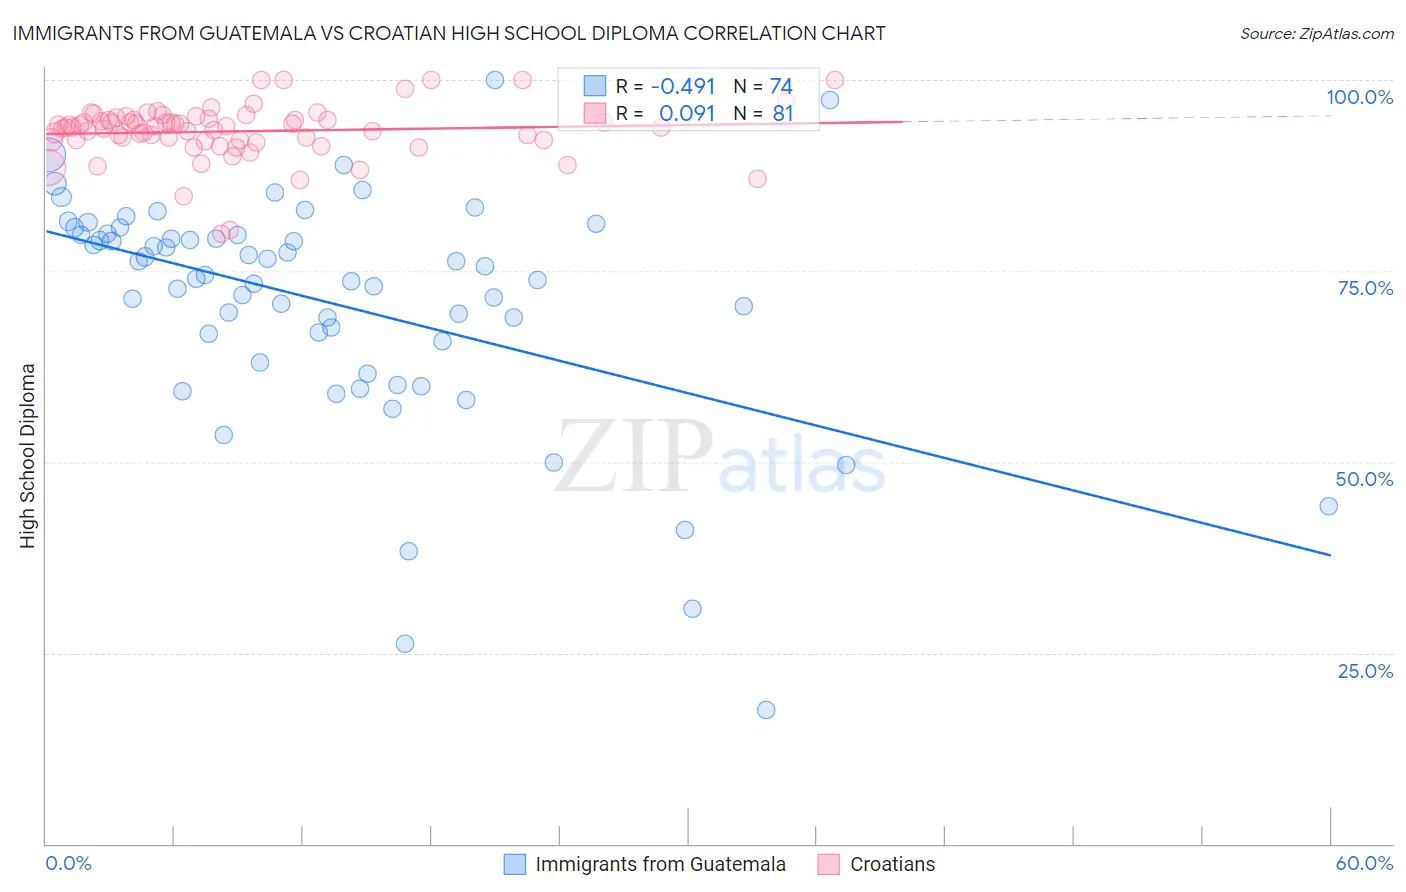
Immigrants from Guatemala vs Croatian High School Diploma Correlation Chart
The statistical analysis conducted on geographies consisting of 377,286,142 people shows a moderate negative correlation between the proportion of Immigrants from Guatemala and percentage of population with at least high school diploma education in the United States with a correlation coefficient (R) of -0.491 and weighted average of 81.4%. Similarly, the statistical analysis conducted on geographies consisting of 375,733,787 people shows a slight positive correlation between the proportion of Croatians and percentage of population with at least high school diploma education in the United States with a correlation coefficient (R) of 0.091 and weighted average of 92.0%, a difference of 13.0%.
High School Diploma Correlation Summary
| Measurement | Immigrants from Guatemala | Croatian |
| Minimum | 17.4% | 79.8% |
| Maximum | 100.0% | 100.0% |
| Range | 82.6% | 20.2% |
| Mean | 70.8% | 93.3% |
| Median | 74.3% | 93.9% |
| Interquartile 25% (IQ1) | 65.9% | 92.1% |
| Interquartile 75% (IQ3) | 79.8% | 94.9% |
| Interquartile Range (IQR) | 13.9% | 2.8% |
| Standard Deviation (Sample) | 15.2% | 3.6% |
| Standard Deviation (Population) | 15.1% | 3.6% |
Similar Demographics by High School Diploma
Demographics Similar to Immigrants from Guatemala by High School Diploma
In terms of high school diploma, the demographic groups most similar to Immigrants from Guatemala are Mexican (81.4%, a difference of 0.040%), Houma (81.5%, a difference of 0.20%), Pima (81.6%, a difference of 0.31%), Salvadoran (81.7%, a difference of 0.40%), and Immigrants from Yemen (81.8%, a difference of 0.58%).
| Demographics | Rating | Rank | High School Diploma |
| Immigrants | Latin America | 0.0 /100 | #333 | Tragic 82.1% |
| Tohono O'odham | 0.0 /100 | #334 | Tragic 82.1% |
| Guatemalans | 0.0 /100 | #335 | Tragic 82.0% |
| Immigrants | Dominican Republic | 0.0 /100 | #336 | Tragic 82.0% |
| Immigrants | Yemen | 0.0 /100 | #337 | Tragic 81.8% |
| Salvadorans | 0.0 /100 | #338 | Tragic 81.7% |
| Pima | 0.0 /100 | #339 | Tragic 81.6% |
| Houma | 0.0 /100 | #340 | Tragic 81.5% |
| Mexicans | 0.0 /100 | #341 | Tragic 81.4% |
| Immigrants | Guatemala | 0.0 /100 | #342 | Tragic 81.4% |
| Immigrants | El Salvador | 0.0 /100 | #343 | Tragic 80.8% |
| Immigrants | Central America | 0.0 /100 | #344 | Tragic 80.1% |
| Yakama | 0.0 /100 | #345 | Tragic 80.0% |
| Spanish American Indians | 0.0 /100 | #346 | Tragic 79.8% |
| Immigrants | Mexico | 0.0 /100 | #347 | Tragic 79.5% |
Demographics Similar to Croatians by High School Diploma
In terms of high school diploma, the demographic groups most similar to Croatians are Latvian (92.0%, a difference of 0.030%), Chinese (92.0%, a difference of 0.050%), Slovak (92.0%, a difference of 0.060%), Immigrants from India (92.0%, a difference of 0.060%), and Eastern European (91.9%, a difference of 0.070%).
| Demographics | Rating | Rank | High School Diploma |
| Carpatho Rusyns | 100.0 /100 | #3 | Exceptional 92.1% |
| Lithuanians | 100.0 /100 | #4 | Exceptional 92.0% |
| Slovenes | 100.0 /100 | #5 | Exceptional 92.0% |
| Slovaks | 100.0 /100 | #6 | Exceptional 92.0% |
| Immigrants | India | 100.0 /100 | #7 | Exceptional 92.0% |
| Chinese | 100.0 /100 | #8 | Exceptional 92.0% |
| Latvians | 100.0 /100 | #9 | Exceptional 92.0% |
| Croatians | 100.0 /100 | #10 | Exceptional 92.0% |
| Eastern Europeans | 100.0 /100 | #11 | Exceptional 91.9% |
| Poles | 100.0 /100 | #12 | Exceptional 91.9% |
| Danes | 100.0 /100 | #13 | Exceptional 91.8% |
| Bulgarians | 100.0 /100 | #14 | Exceptional 91.8% |
| Luxembourgers | 100.0 /100 | #15 | Exceptional 91.7% |
| Finns | 100.0 /100 | #16 | Exceptional 91.7% |
| Immigrants | Singapore | 99.9 /100 | #17 | Exceptional 91.7% |