Asian vs Immigrants from Haiti Bachelor's Degree
COMPARE
Asian
Immigrants from Haiti
Bachelor's Degree
Bachelor's Degree Comparison
Asians
Immigrants from Haiti
44.4%
BACHELOR'S DEGREE
99.9/ 100
METRIC RATING
51st/ 347
METRIC RANK
30.6%
BACHELOR'S DEGREE
0.0/ 100
METRIC RATING
297th/ 347
METRIC RANK
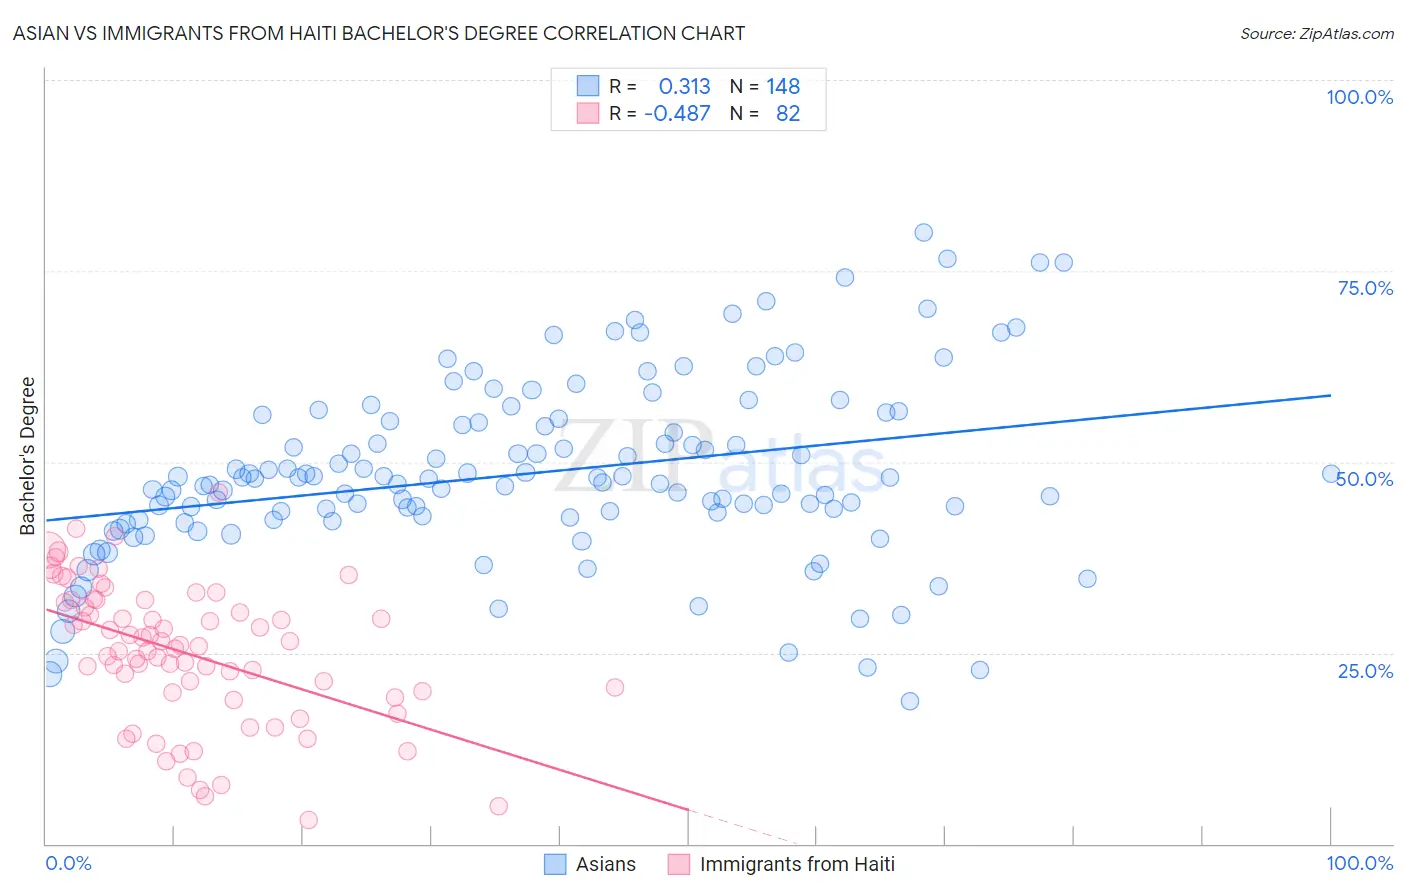
Asian vs Immigrants from Haiti Bachelor's Degree Correlation Chart
The statistical analysis conducted on geographies consisting of 550,793,799 people shows a mild positive correlation between the proportion of Asians and percentage of population with at least bachelor's degree education in the United States with a correlation coefficient (R) of 0.313 and weighted average of 44.4%. Similarly, the statistical analysis conducted on geographies consisting of 225,272,014 people shows a moderate negative correlation between the proportion of Immigrants from Haiti and percentage of population with at least bachelor's degree education in the United States with a correlation coefficient (R) of -0.487 and weighted average of 30.6%, a difference of 44.9%.
Bachelor's Degree Correlation Summary
| Measurement | Asian | Immigrants from Haiti |
| Minimum | 18.6% | 3.0% |
| Maximum | 80.1% | 46.1% |
| Range | 61.5% | 43.0% |
| Mean | 48.5% | 25.0% |
| Median | 47.5% | 25.9% |
| Interquartile 25% (IQ1) | 42.5% | 19.8% |
| Interquartile 75% (IQ3) | 55.2% | 31.9% |
| Interquartile Range (IQR) | 12.7% | 12.1% |
| Standard Deviation (Sample) | 11.7% | 9.2% |
| Standard Deviation (Population) | 11.7% | 9.2% |
Similar Demographics by Bachelor's Degree
Demographics Similar to Asians by Bachelor's Degree
In terms of bachelor's degree, the demographic groups most similar to Asians are Immigrants from Greece (44.5%, a difference of 0.14%), Immigrants from Spain (44.3%, a difference of 0.18%), Immigrants from Asia (44.3%, a difference of 0.24%), Immigrants from Norway (44.5%, a difference of 0.25%), and Bolivian (44.6%, a difference of 0.38%).
| Demographics | Rating | Rank | Bachelor's Degree |
| Immigrants | Lithuania | 99.9 /100 | #44 | Exceptional 44.6% |
| Immigrants | Kuwait | 99.9 /100 | #45 | Exceptional 44.6% |
| Immigrants | Bulgaria | 99.9 /100 | #46 | Exceptional 44.6% |
| Bolivians | 99.9 /100 | #47 | Exceptional 44.6% |
| Estonians | 99.9 /100 | #48 | Exceptional 44.6% |
| Immigrants | Norway | 99.9 /100 | #49 | Exceptional 44.5% |
| Immigrants | Greece | 99.9 /100 | #50 | Exceptional 44.5% |
| Asians | 99.9 /100 | #51 | Exceptional 44.4% |
| Immigrants | Spain | 99.9 /100 | #52 | Exceptional 44.3% |
| Immigrants | Asia | 99.9 /100 | #53 | Exceptional 44.3% |
| Immigrants | Austria | 99.9 /100 | #54 | Exceptional 44.2% |
| Immigrants | Bolivia | 99.9 /100 | #55 | Exceptional 44.2% |
| Immigrants | Serbia | 99.9 /100 | #56 | Exceptional 44.1% |
| Paraguayans | 99.9 /100 | #57 | Exceptional 44.0% |
| Immigrants | Czechoslovakia | 99.9 /100 | #58 | Exceptional 44.0% |
Demographics Similar to Immigrants from Haiti by Bachelor's Degree
In terms of bachelor's degree, the demographic groups most similar to Immigrants from Haiti are Puget Sound Salish (30.7%, a difference of 0.060%), Immigrants from Dominican Republic (30.7%, a difference of 0.16%), Chippewa (30.6%, a difference of 0.25%), Immigrants from Guatemala (30.8%, a difference of 0.40%), and Chickasaw (30.4%, a difference of 0.77%).
| Demographics | Rating | Rank | Bachelor's Degree |
| Immigrants | Honduras | 0.1 /100 | #290 | Tragic 30.9% |
| Blacks/African Americans | 0.1 /100 | #291 | Tragic 30.9% |
| Ute | 0.1 /100 | #292 | Tragic 30.9% |
| Cape Verdeans | 0.1 /100 | #293 | Tragic 30.9% |
| Immigrants | Guatemala | 0.0 /100 | #294 | Tragic 30.8% |
| Immigrants | Dominican Republic | 0.0 /100 | #295 | Tragic 30.7% |
| Puget Sound Salish | 0.0 /100 | #296 | Tragic 30.7% |
| Immigrants | Haiti | 0.0 /100 | #297 | Tragic 30.6% |
| Chippewa | 0.0 /100 | #298 | Tragic 30.6% |
| Chickasaw | 0.0 /100 | #299 | Tragic 30.4% |
| Immigrants | Micronesia | 0.0 /100 | #300 | Tragic 30.4% |
| Immigrants | Cuba | 0.0 /100 | #301 | Tragic 30.3% |
| Mexican American Indians | 0.0 /100 | #302 | Tragic 30.2% |
| Bangladeshis | 0.0 /100 | #303 | Tragic 30.2% |
| Cherokee | 0.0 /100 | #304 | Tragic 30.2% |