Asian vs Immigrants from Indonesia High School Diploma
COMPARE
Asian
Immigrants from Indonesia
High School Diploma
High School Diploma Comparison
Asians
Immigrants from Indonesia
89.4%
HIGH SCHOOL DIPLOMA
70.7/ 100
METRIC RATING
152nd/ 347
METRIC RANK
89.1%
HIGH SCHOOL DIPLOMA
50.3/ 100
METRIC RATING
173rd/ 347
METRIC RANK
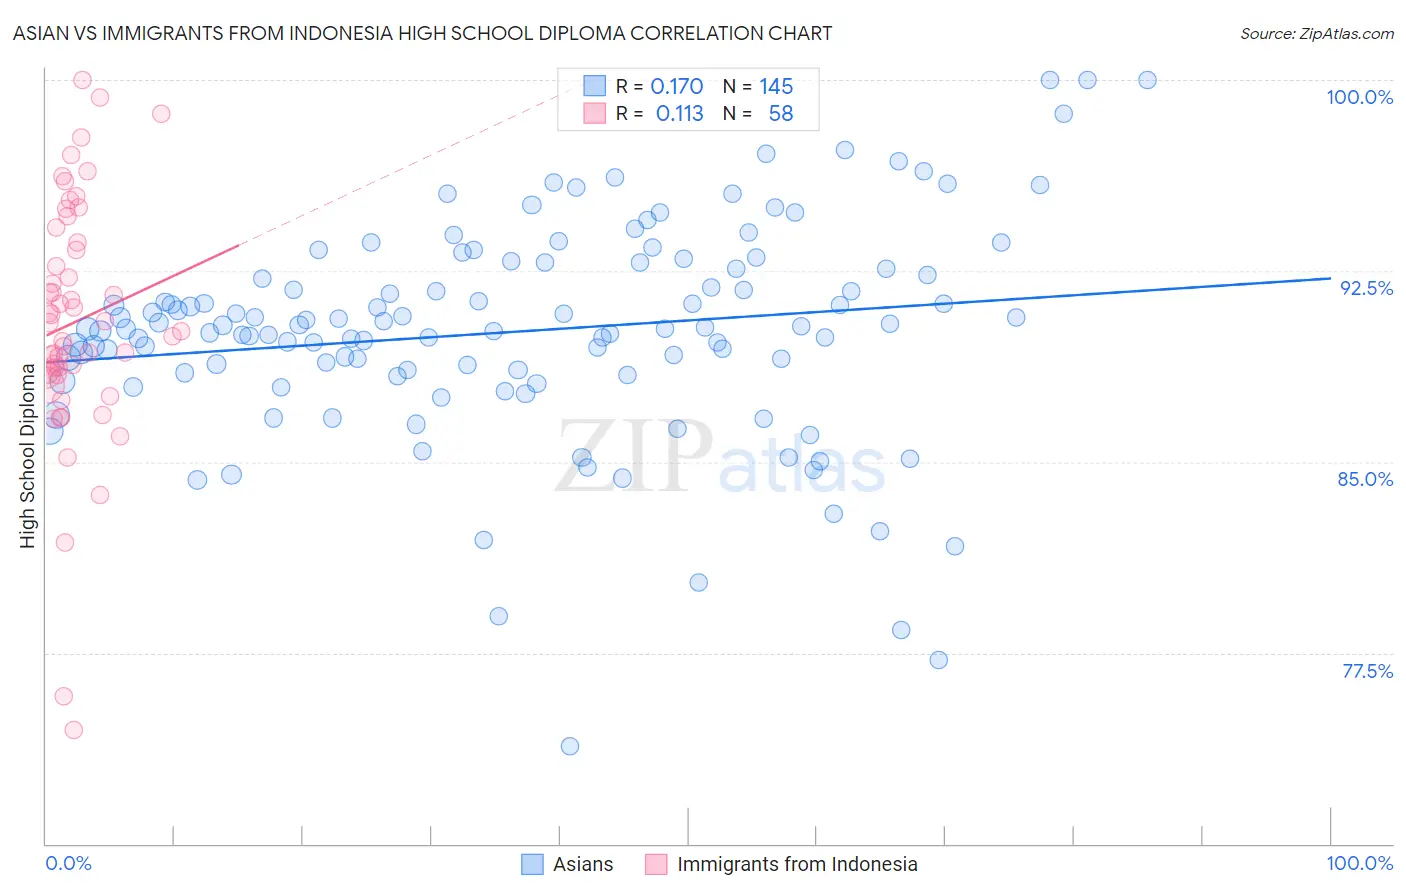
Asian vs Immigrants from Indonesia High School Diploma Correlation Chart
The statistical analysis conducted on geographies consisting of 550,718,935 people shows a poor positive correlation between the proportion of Asians and percentage of population with at least high school diploma education in the United States with a correlation coefficient (R) of 0.170 and weighted average of 89.4%. Similarly, the statistical analysis conducted on geographies consisting of 215,765,946 people shows a poor positive correlation between the proportion of Immigrants from Indonesia and percentage of population with at least high school diploma education in the United States with a correlation coefficient (R) of 0.113 and weighted average of 89.1%, a difference of 0.33%.
High School Diploma Correlation Summary
| Measurement | Asian | Immigrants from Indonesia |
| Minimum | 73.8% | 74.5% |
| Maximum | 100.0% | 100.0% |
| Range | 26.2% | 25.5% |
| Mean | 90.1% | 90.5% |
| Median | 90.2% | 90.3% |
| Interquartile 25% (IQ1) | 88.5% | 88.4% |
| Interquartile 75% (IQ3) | 92.6% | 93.6% |
| Interquartile Range (IQR) | 4.1% | 5.2% |
| Standard Deviation (Sample) | 4.2% | 4.8% |
| Standard Deviation (Population) | 4.2% | 4.8% |
Similar Demographics by High School Diploma
Demographics Similar to Asians by High School Diploma
In terms of high school diploma, the demographic groups most similar to Asians are Paraguayan (89.5%, a difference of 0.010%), Argentinean (89.5%, a difference of 0.030%), Immigrants from Poland (89.5%, a difference of 0.040%), Immigrants from Iraq (89.4%, a difference of 0.040%), and Immigrants from Lebanon (89.5%, a difference of 0.050%).
| Demographics | Rating | Rank | High School Diploma |
| Immigrants | Brazil | 76.6 /100 | #145 | Good 89.5% |
| Immigrants | Spain | 76.2 /100 | #146 | Good 89.5% |
| Iraqis | 73.9 /100 | #147 | Good 89.5% |
| Immigrants | Lebanon | 73.4 /100 | #148 | Good 89.5% |
| Immigrants | Poland | 72.9 /100 | #149 | Good 89.5% |
| Argentineans | 72.3 /100 | #150 | Good 89.5% |
| Paraguayans | 71.4 /100 | #151 | Good 89.5% |
| Asians | 70.7 /100 | #152 | Good 89.4% |
| Immigrants | Iraq | 68.7 /100 | #153 | Good 89.4% |
| Alsatians | 66.8 /100 | #154 | Good 89.4% |
| Immigrants | Northern Africa | 66.4 /100 | #155 | Good 89.4% |
| Immigrants | Argentina | 65.5 /100 | #156 | Good 89.4% |
| Immigrants | Malaysia | 63.5 /100 | #157 | Good 89.3% |
| Immigrants | Pakistan | 62.5 /100 | #158 | Good 89.3% |
| Immigrants | China | 62.0 /100 | #159 | Good 89.3% |
Demographics Similar to Immigrants from Indonesia by High School Diploma
In terms of high school diploma, the demographic groups most similar to Immigrants from Indonesia are Hmong (89.1%, a difference of 0.0%), Nonimmigrants (89.2%, a difference of 0.020%), Immigrants from Western Asia (89.1%, a difference of 0.020%), Osage (89.1%, a difference of 0.020%), and Sudanese (89.1%, a difference of 0.030%).
| Demographics | Rating | Rank | High School Diploma |
| Immigrants | Albania | 59.4 /100 | #166 | Average 89.3% |
| Immigrants | Hong Kong | 58.6 /100 | #167 | Average 89.3% |
| Delaware | 55.8 /100 | #168 | Average 89.2% |
| Iroquois | 55.1 /100 | #169 | Average 89.2% |
| Immigrants | Morocco | 53.3 /100 | #170 | Average 89.2% |
| Spanish | 52.9 /100 | #171 | Average 89.2% |
| Immigrants | Nonimmigrants | 51.8 /100 | #172 | Average 89.2% |
| Immigrants | Indonesia | 50.3 /100 | #173 | Average 89.1% |
| Hmong | 50.0 /100 | #174 | Average 89.1% |
| Immigrants | Western Asia | 49.0 /100 | #175 | Average 89.1% |
| Osage | 48.9 /100 | #176 | Average 89.1% |
| Sudanese | 48.5 /100 | #177 | Average 89.1% |
| Sierra Leoneans | 48.4 /100 | #178 | Average 89.1% |
| Americans | 47.2 /100 | #179 | Average 89.1% |
| Bolivians | 45.2 /100 | #180 | Average 89.1% |