Armenian vs Lebanese Associate's Degree
COMPARE
Armenian
Lebanese
Associate's Degree
Associate's Degree Comparison
Armenians
Lebanese
50.4%
ASSOCIATE'S DEGREE
99.1/ 100
METRIC RATING
80th/ 347
METRIC RANK
48.8%
ASSOCIATE'S DEGREE
94.6/ 100
METRIC RATING
119th/ 347
METRIC RANK
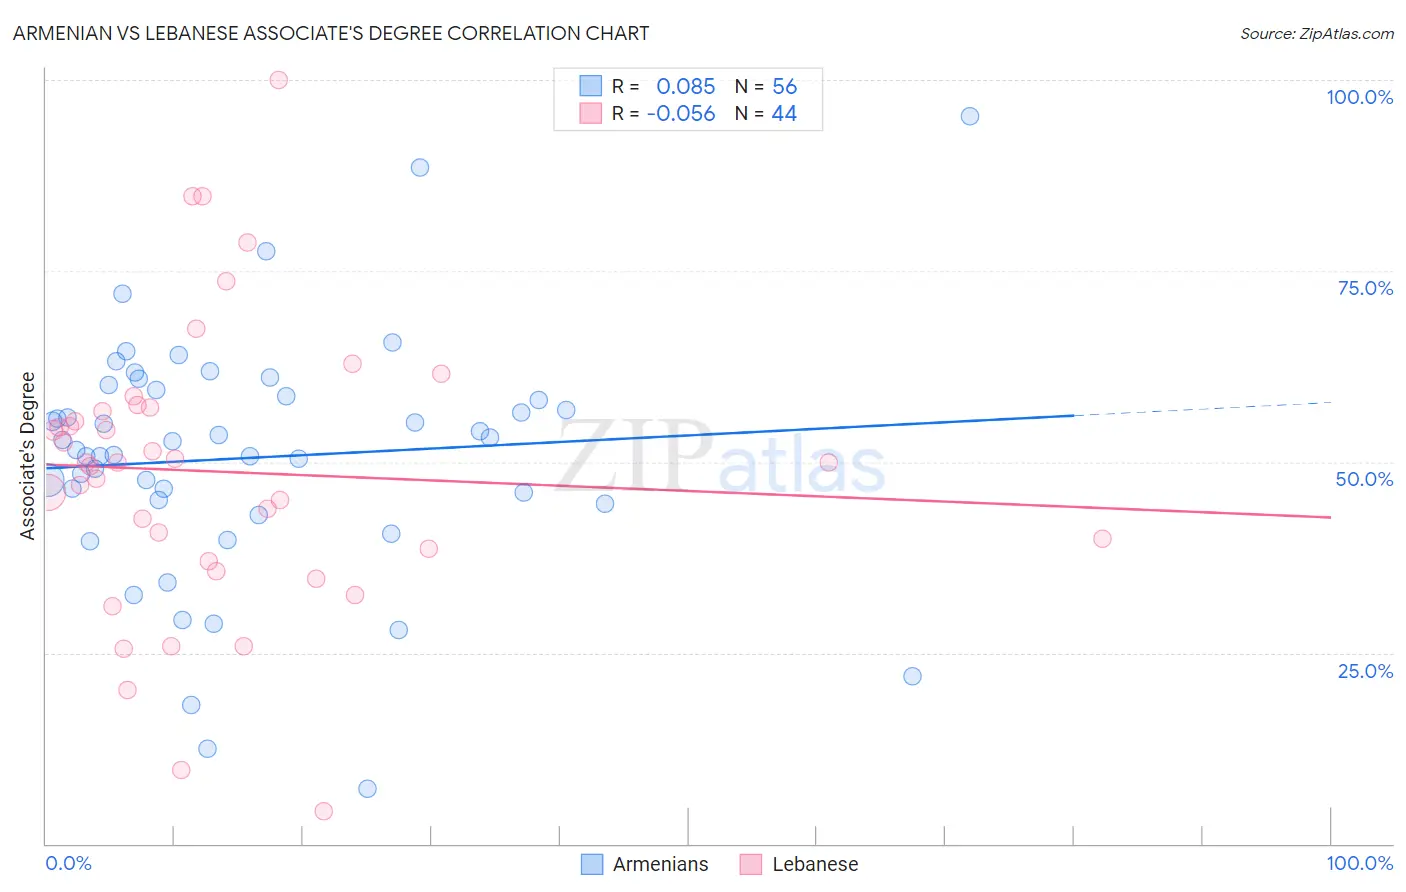
Armenian vs Lebanese Associate's Degree Correlation Chart
The statistical analysis conducted on geographies consisting of 310,941,710 people shows a slight positive correlation between the proportion of Armenians and percentage of population with at least associate's degree education in the United States with a correlation coefficient (R) of 0.085 and weighted average of 50.4%. Similarly, the statistical analysis conducted on geographies consisting of 401,605,631 people shows a slight negative correlation between the proportion of Lebanese and percentage of population with at least associate's degree education in the United States with a correlation coefficient (R) of -0.056 and weighted average of 48.8%, a difference of 3.3%.
Associate's Degree Correlation Summary
| Measurement | Armenian | Lebanese |
| Minimum | 7.2% | 4.3% |
| Maximum | 95.3% | 100.0% |
| Range | 88.1% | 95.7% |
| Mean | 50.6% | 48.7% |
| Median | 52.1% | 49.9% |
| Interquartile 25% (IQ1) | 44.7% | 37.8% |
| Interquartile 75% (IQ3) | 59.0% | 56.9% |
| Interquartile Range (IQR) | 14.3% | 19.1% |
| Standard Deviation (Sample) | 16.0% | 18.8% |
| Standard Deviation (Population) | 15.9% | 18.6% |
Similar Demographics by Associate's Degree
Demographics Similar to Armenians by Associate's Degree
In terms of associate's degree, the demographic groups most similar to Armenians are Ethiopian (50.4%, a difference of 0.030%), Immigrants from Eastern Europe (50.5%, a difference of 0.050%), Maltese (50.4%, a difference of 0.070%), Immigrants from Lebanon (50.5%, a difference of 0.090%), and Immigrants from Zimbabwe (50.5%, a difference of 0.12%).
| Demographics | Rating | Rank | Associate's Degree |
| Carpatho Rusyns | 99.3 /100 | #73 | Exceptional 50.6% |
| Lithuanians | 99.3 /100 | #74 | Exceptional 50.6% |
| Immigrants | Scotland | 99.3 /100 | #75 | Exceptional 50.6% |
| Immigrants | Zimbabwe | 99.2 /100 | #76 | Exceptional 50.5% |
| Immigrants | Lebanon | 99.1 /100 | #77 | Exceptional 50.5% |
| Immigrants | Eastern Europe | 99.1 /100 | #78 | Exceptional 50.5% |
| Ethiopians | 99.1 /100 | #79 | Exceptional 50.4% |
| Armenians | 99.1 /100 | #80 | Exceptional 50.4% |
| Maltese | 99.1 /100 | #81 | Exceptional 50.4% |
| Greeks | 98.9 /100 | #82 | Exceptional 50.3% |
| Immigrants | Uzbekistan | 98.9 /100 | #83 | Exceptional 50.3% |
| Immigrants | Hungary | 98.9 /100 | #84 | Exceptional 50.2% |
| Immigrants | Egypt | 98.9 /100 | #85 | Exceptional 50.2% |
| Immigrants | Croatia | 98.9 /100 | #86 | Exceptional 50.2% |
| Immigrants | Moldova | 98.8 /100 | #87 | Exceptional 50.2% |
Demographics Similar to Lebanese by Associate's Degree
In terms of associate's degree, the demographic groups most similar to Lebanese are Albanian (48.8%, a difference of 0.010%), Alsatian (48.8%, a difference of 0.020%), Afghan (48.9%, a difference of 0.070%), British (48.9%, a difference of 0.12%), and Luxembourger (48.9%, a difference of 0.18%).
| Demographics | Rating | Rank | Associate's Degree |
| Immigrants | Chile | 95.3 /100 | #112 | Exceptional 49.0% |
| Palestinians | 95.3 /100 | #113 | Exceptional 49.0% |
| Arabs | 95.3 /100 | #114 | Exceptional 49.0% |
| Luxembourgers | 95.1 /100 | #115 | Exceptional 48.9% |
| British | 95.0 /100 | #116 | Exceptional 48.9% |
| Afghans | 94.8 /100 | #117 | Exceptional 48.9% |
| Albanians | 94.7 /100 | #118 | Exceptional 48.8% |
| Lebanese | 94.6 /100 | #119 | Exceptional 48.8% |
| Alsatians | 94.6 /100 | #120 | Exceptional 48.8% |
| Ugandans | 93.9 /100 | #121 | Exceptional 48.7% |
| Italians | 93.9 /100 | #122 | Exceptional 48.7% |
| Brazilians | 93.7 /100 | #123 | Exceptional 48.7% |
| Serbians | 92.6 /100 | #124 | Exceptional 48.5% |
| Chinese | 92.5 /100 | #125 | Exceptional 48.5% |
| Immigrants | Syria | 92.2 /100 | #126 | Exceptional 48.5% |