Armenian vs French American Indian Associate's Degree
COMPARE
Armenian
French American Indian
Associate's Degree
Associate's Degree Comparison
Armenians
French American Indians
50.4%
ASSOCIATE'S DEGREE
99.1/ 100
METRIC RATING
80th/ 347
METRIC RANK
42.0%
ASSOCIATE'S DEGREE
0.6/ 100
METRIC RATING
252nd/ 347
METRIC RANK
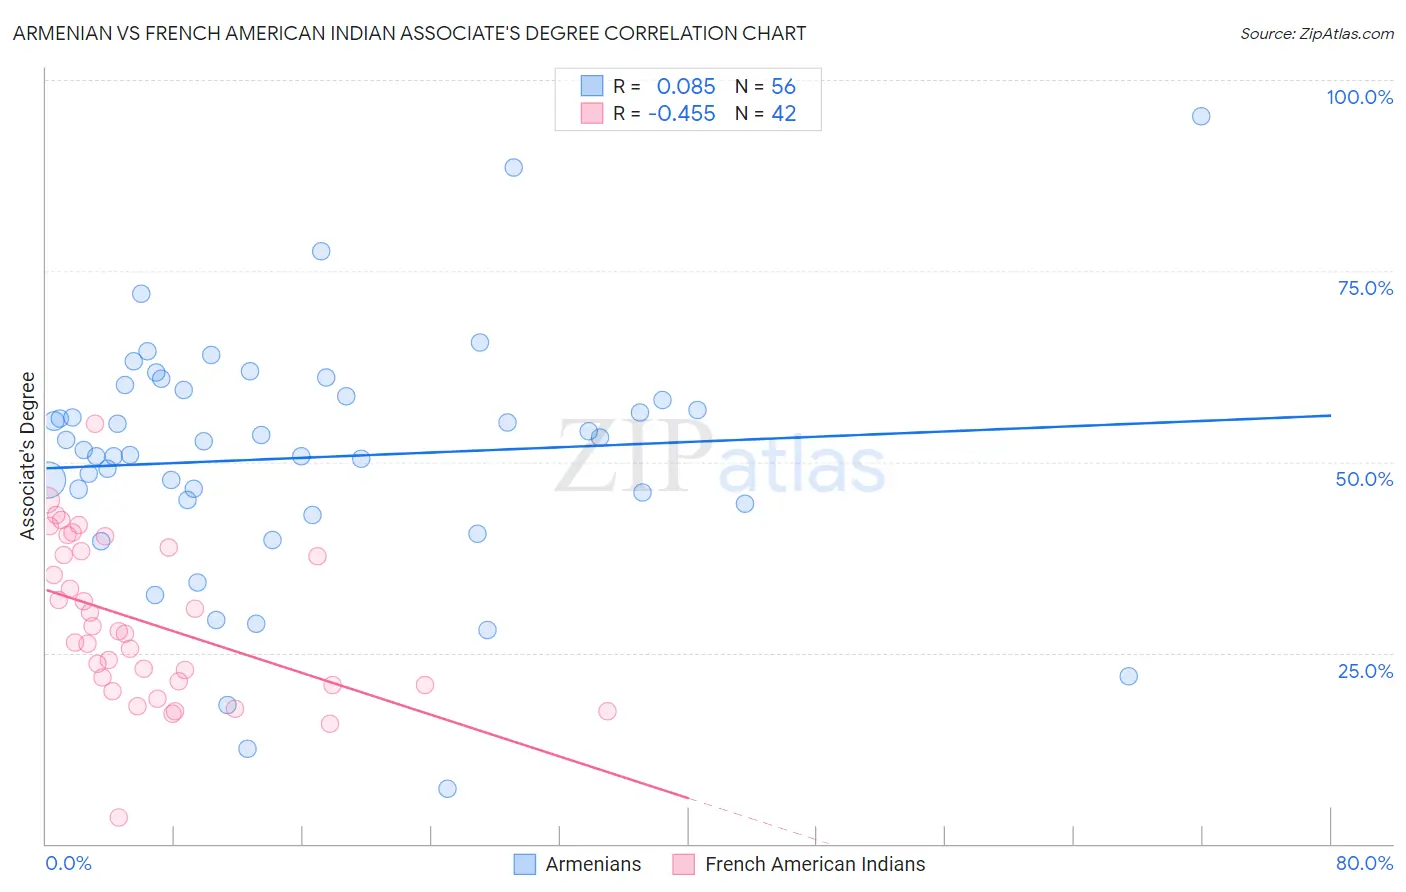
Armenian vs French American Indian Associate's Degree Correlation Chart
The statistical analysis conducted on geographies consisting of 310,941,710 people shows a slight positive correlation between the proportion of Armenians and percentage of population with at least associate's degree education in the United States with a correlation coefficient (R) of 0.085 and weighted average of 50.4%. Similarly, the statistical analysis conducted on geographies consisting of 131,974,565 people shows a moderate negative correlation between the proportion of French American Indians and percentage of population with at least associate's degree education in the United States with a correlation coefficient (R) of -0.455 and weighted average of 42.0%, a difference of 20.2%.
Associate's Degree Correlation Summary
| Measurement | Armenian | French American Indian |
| Minimum | 7.2% | 3.4% |
| Maximum | 95.3% | 55.0% |
| Range | 88.1% | 51.5% |
| Mean | 50.6% | 29.1% |
| Median | 52.1% | 27.6% |
| Interquartile 25% (IQ1) | 44.7% | 20.8% |
| Interquartile 75% (IQ3) | 59.0% | 38.3% |
| Interquartile Range (IQR) | 14.3% | 17.5% |
| Standard Deviation (Sample) | 16.0% | 10.5% |
| Standard Deviation (Population) | 15.9% | 10.4% |
Similar Demographics by Associate's Degree
Demographics Similar to Armenians by Associate's Degree
In terms of associate's degree, the demographic groups most similar to Armenians are Ethiopian (50.4%, a difference of 0.030%), Immigrants from Eastern Europe (50.5%, a difference of 0.050%), Maltese (50.4%, a difference of 0.070%), Immigrants from Lebanon (50.5%, a difference of 0.090%), and Immigrants from Zimbabwe (50.5%, a difference of 0.12%).
| Demographics | Rating | Rank | Associate's Degree |
| Carpatho Rusyns | 99.3 /100 | #73 | Exceptional 50.6% |
| Lithuanians | 99.3 /100 | #74 | Exceptional 50.6% |
| Immigrants | Scotland | 99.3 /100 | #75 | Exceptional 50.6% |
| Immigrants | Zimbabwe | 99.2 /100 | #76 | Exceptional 50.5% |
| Immigrants | Lebanon | 99.1 /100 | #77 | Exceptional 50.5% |
| Immigrants | Eastern Europe | 99.1 /100 | #78 | Exceptional 50.5% |
| Ethiopians | 99.1 /100 | #79 | Exceptional 50.4% |
| Armenians | 99.1 /100 | #80 | Exceptional 50.4% |
| Maltese | 99.1 /100 | #81 | Exceptional 50.4% |
| Greeks | 98.9 /100 | #82 | Exceptional 50.3% |
| Immigrants | Uzbekistan | 98.9 /100 | #83 | Exceptional 50.3% |
| Immigrants | Hungary | 98.9 /100 | #84 | Exceptional 50.2% |
| Immigrants | Egypt | 98.9 /100 | #85 | Exceptional 50.2% |
| Immigrants | Croatia | 98.9 /100 | #86 | Exceptional 50.2% |
| Immigrants | Moldova | 98.8 /100 | #87 | Exceptional 50.2% |
Demographics Similar to French American Indians by Associate's Degree
In terms of associate's degree, the demographic groups most similar to French American Indians are Indonesian (41.9%, a difference of 0.10%), Cuban (41.9%, a difference of 0.17%), Immigrants from Guyana (41.8%, a difference of 0.25%), Immigrants from Bahamas (42.1%, a difference of 0.36%), and U.S. Virgin Islander (42.1%, a difference of 0.38%).
| Demographics | Rating | Rank | Associate's Degree |
| Immigrants | Cambodia | 0.9 /100 | #245 | Tragic 42.3% |
| Delaware | 0.9 /100 | #246 | Tragic 42.3% |
| Immigrants | Fiji | 0.8 /100 | #247 | Tragic 42.2% |
| Immigrants | Ecuador | 0.8 /100 | #248 | Tragic 42.2% |
| Jamaicans | 0.7 /100 | #249 | Tragic 42.1% |
| U.S. Virgin Islanders | 0.7 /100 | #250 | Tragic 42.1% |
| Immigrants | Bahamas | 0.7 /100 | #251 | Tragic 42.1% |
| French American Indians | 0.6 /100 | #252 | Tragic 42.0% |
| Indonesians | 0.6 /100 | #253 | Tragic 41.9% |
| Cubans | 0.6 /100 | #254 | Tragic 41.9% |
| Immigrants | Guyana | 0.5 /100 | #255 | Tragic 41.8% |
| Immigrants | Congo | 0.5 /100 | #256 | Tragic 41.8% |
| Spanish Americans | 0.5 /100 | #257 | Tragic 41.8% |
| Japanese | 0.5 /100 | #258 | Tragic 41.7% |
| Malaysians | 0.4 /100 | #259 | Tragic 41.6% |