Argentinean vs Immigrants from Japan Nursery School
COMPARE
Argentinean
Immigrants from Japan
Nursery School
Nursery School Comparison
Argentineans
Immigrants from Japan
98.0%
NURSERY SCHOOL
46.8/ 100
METRIC RATING
179th/ 347
METRIC RANK
98.2%
NURSERY SCHOOL
94.0/ 100
METRIC RATING
122nd/ 347
METRIC RANK
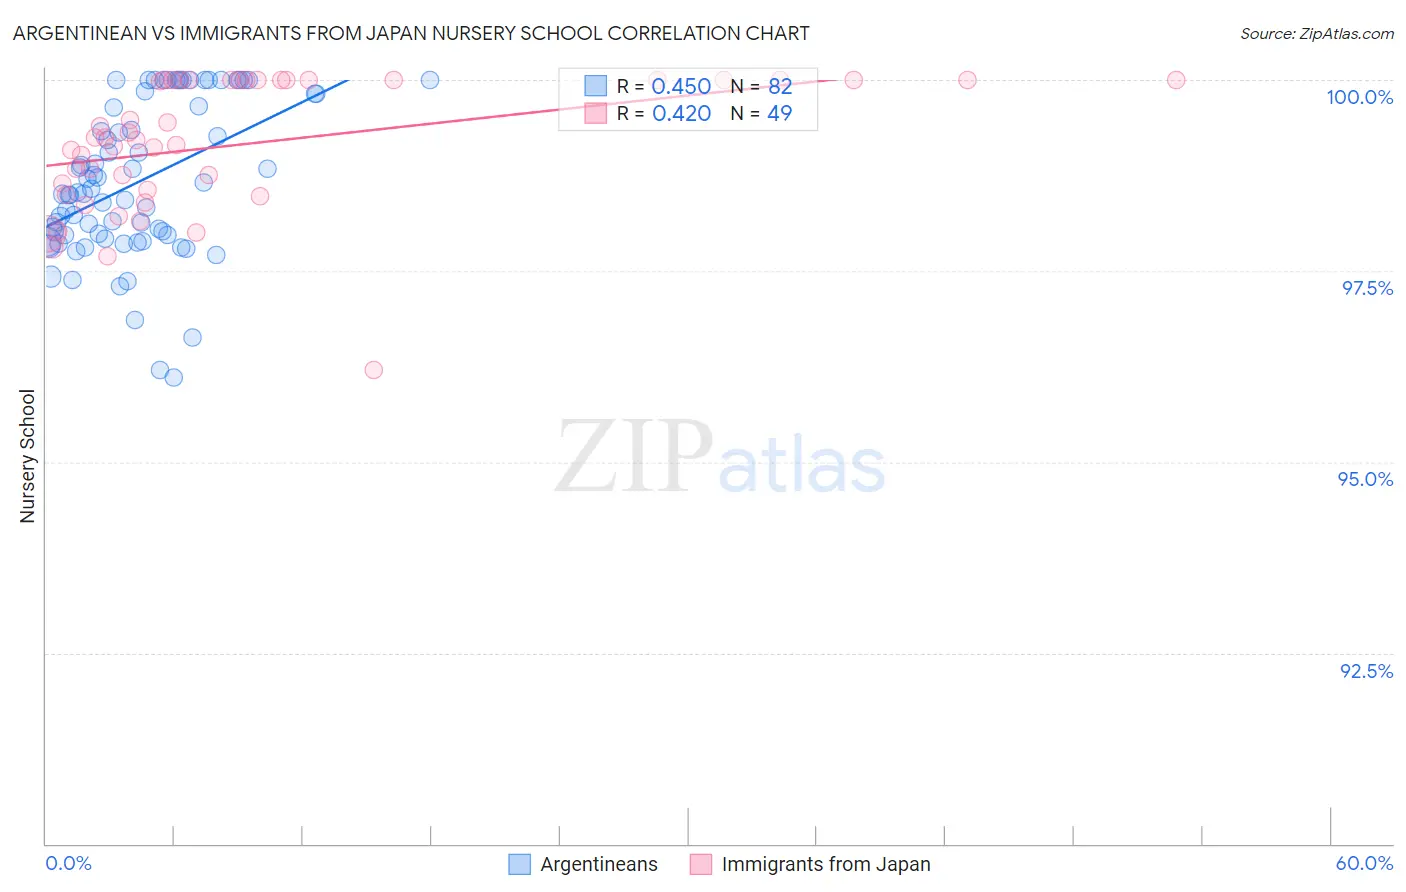
Argentinean vs Immigrants from Japan Nursery School Correlation Chart
The statistical analysis conducted on geographies consisting of 297,146,811 people shows a moderate positive correlation between the proportion of Argentineans and percentage of population with at least nursery school education in the United States with a correlation coefficient (R) of 0.450 and weighted average of 98.0%. Similarly, the statistical analysis conducted on geographies consisting of 340,149,128 people shows a moderate positive correlation between the proportion of Immigrants from Japan and percentage of population with at least nursery school education in the United States with a correlation coefficient (R) of 0.420 and weighted average of 98.2%, a difference of 0.22%.
Nursery School Correlation Summary
| Measurement | Argentinean | Immigrants from Japan |
| Minimum | 96.1% | 96.2% |
| Maximum | 100.0% | 100.0% |
| Range | 3.9% | 3.8% |
| Mean | 98.7% | 99.2% |
| Median | 98.5% | 99.2% |
| Interquartile 25% (IQ1) | 98.0% | 98.5% |
| Interquartile 75% (IQ3) | 99.8% | 100.0% |
| Interquartile Range (IQR) | 1.8% | 1.5% |
| Standard Deviation (Sample) | 1.00% | 0.86% |
| Standard Deviation (Population) | 0.99% | 0.85% |
Similar Demographics by Nursery School
Demographics Similar to Argentineans by Nursery School
In terms of nursery school, the demographic groups most similar to Argentineans are Immigrants from Bosnia and Herzegovina (98.0%, a difference of 0.0%), Immigrants from Brazil (98.0%, a difference of 0.010%), Kenyan (98.0%, a difference of 0.010%), Navajo (98.0%, a difference of 0.010%), and Immigrants from Sri Lanka (98.0%, a difference of 0.010%).
| Demographics | Rating | Rank | Nursery School |
| Immigrants | Brazil | 51.3 /100 | #172 | Average 98.0% |
| Kenyans | 50.2 /100 | #173 | Average 98.0% |
| Navajo | 50.0 /100 | #174 | Average 98.0% |
| Immigrants | Sri Lanka | 49.9 /100 | #175 | Average 98.0% |
| Immigrants | Venezuela | 49.8 /100 | #176 | Average 98.0% |
| Albanians | 48.9 /100 | #177 | Average 98.0% |
| Natives/Alaskans | 48.6 /100 | #178 | Average 98.0% |
| Argentineans | 46.8 /100 | #179 | Average 98.0% |
| Immigrants | Bosnia and Herzegovina | 45.6 /100 | #180 | Average 98.0% |
| Egyptians | 42.8 /100 | #181 | Average 98.0% |
| Paiute | 42.0 /100 | #182 | Average 98.0% |
| Portuguese | 41.8 /100 | #183 | Average 98.0% |
| Immigrants | Poland | 41.3 /100 | #184 | Average 98.0% |
| Immigrants | Belarus | 41.0 /100 | #185 | Average 98.0% |
| Immigrants | Argentina | 40.8 /100 | #186 | Average 98.0% |
Demographics Similar to Immigrants from Japan by Nursery School
In terms of nursery school, the demographic groups most similar to Immigrants from Japan are Immigrants from Zimbabwe (98.2%, a difference of 0.0%), Syrian (98.2%, a difference of 0.0%), Lebanese (98.2%, a difference of 0.0%), Iroquois (98.2%, a difference of 0.0%), and Okinawan (98.2%, a difference of 0.010%).
| Demographics | Rating | Rank | Nursery School |
| Iranians | 96.3 /100 | #115 | Exceptional 98.2% |
| Spanish | 95.8 /100 | #116 | Exceptional 98.2% |
| Immigrants | France | 95.6 /100 | #117 | Exceptional 98.2% |
| Yugoslavians | 95.4 /100 | #118 | Exceptional 98.2% |
| Thais | 95.0 /100 | #119 | Exceptional 98.2% |
| Okinawans | 94.5 /100 | #120 | Exceptional 98.2% |
| Immigrants | Zimbabwe | 94.2 /100 | #121 | Exceptional 98.2% |
| Immigrants | Japan | 94.0 /100 | #122 | Exceptional 98.2% |
| Syrians | 93.9 /100 | #123 | Exceptional 98.2% |
| Lebanese | 93.8 /100 | #124 | Exceptional 98.2% |
| Iroquois | 93.7 /100 | #125 | Exceptional 98.2% |
| Menominee | 93.6 /100 | #126 | Exceptional 98.2% |
| Immigrants | Saudi Arabia | 93.4 /100 | #127 | Exceptional 98.2% |
| Immigrants | Serbia | 92.4 /100 | #128 | Exceptional 98.2% |
| Cambodians | 91.4 /100 | #129 | Exceptional 98.2% |