Armenian vs Iranian College, 1 year or more
COMPARE
Armenian
Iranian
College, 1 year or more
College, 1 year or more Comparison
Armenians
Iranians
63.0%
COLLEGE, 1 YEAR OR MORE
98.9/ 100
METRIC RATING
75th/ 347
METRIC RANK
70.0%
COLLEGE, 1 YEAR OR MORE
100.0/ 100
METRIC RATING
3rd/ 347
METRIC RANK
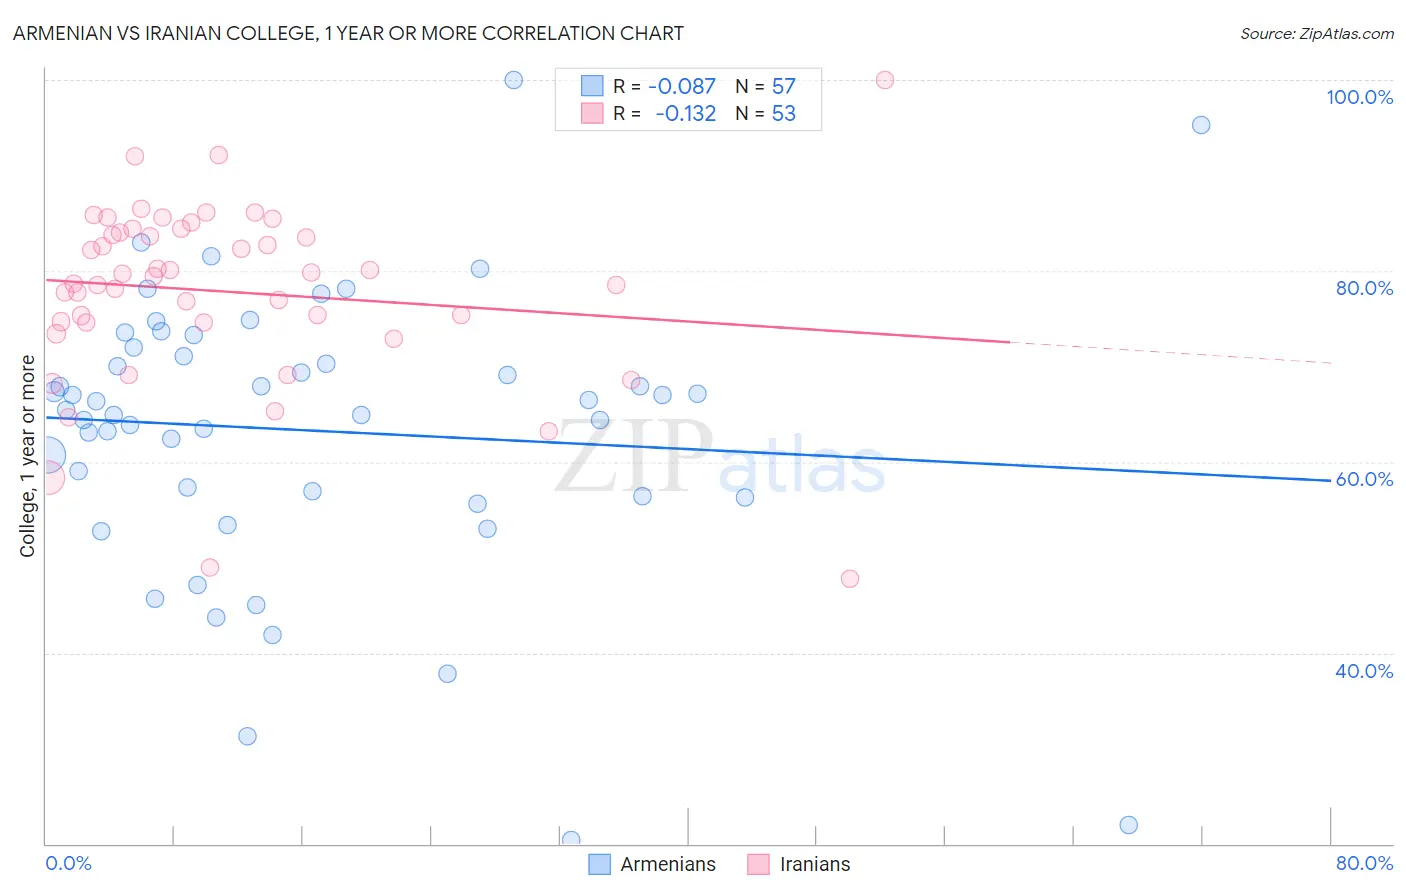
Armenian vs Iranian College, 1 year or more Correlation Chart
The statistical analysis conducted on geographies consisting of 310,952,439 people shows a slight negative correlation between the proportion of Armenians and percentage of population with at least college, 1 year or more education in the United States with a correlation coefficient (R) of -0.087 and weighted average of 63.0%. Similarly, the statistical analysis conducted on geographies consisting of 316,900,663 people shows a poor negative correlation between the proportion of Iranians and percentage of population with at least college, 1 year or more education in the United States with a correlation coefficient (R) of -0.132 and weighted average of 70.0%, a difference of 11.1%.
College, 1 year or more Correlation Summary
| Measurement | Armenian | Iranian |
| Minimum | 20.5% | 47.7% |
| Maximum | 100.0% | 100.0% |
| Range | 79.5% | 52.3% |
| Mean | 63.3% | 77.8% |
| Median | 65.4% | 79.4% |
| Interquartile 25% (IQ1) | 56.3% | 74.6% |
| Interquartile 75% (IQ3) | 71.5% | 84.2% |
| Interquartile Range (IQR) | 15.2% | 9.7% |
| Standard Deviation (Sample) | 15.0% | 9.6% |
| Standard Deviation (Population) | 14.9% | 9.6% |
Similar Demographics by College, 1 year or more
Demographics Similar to Armenians by College, 1 year or more
In terms of college, 1 year or more, the demographic groups most similar to Armenians are Immigrants from North America (63.0%, a difference of 0.090%), Paraguayan (62.9%, a difference of 0.10%), Ethiopian (62.9%, a difference of 0.10%), Immigrants from Moldova (63.0%, a difference of 0.11%), and Egyptian (63.1%, a difference of 0.12%).
| Demographics | Rating | Rank | College, 1 year or more |
| Immigrants | Greece | 99.3 /100 | #68 | Exceptional 63.3% |
| Immigrants | Zimbabwe | 99.3 /100 | #69 | Exceptional 63.3% |
| Argentineans | 99.2 /100 | #70 | Exceptional 63.2% |
| Immigrants | Canada | 99.1 /100 | #71 | Exceptional 63.1% |
| Egyptians | 99.0 /100 | #72 | Exceptional 63.1% |
| Immigrants | Moldova | 99.0 /100 | #73 | Exceptional 63.0% |
| Immigrants | North America | 99.0 /100 | #74 | Exceptional 63.0% |
| Armenians | 98.9 /100 | #75 | Exceptional 63.0% |
| Paraguayans | 98.8 /100 | #76 | Exceptional 62.9% |
| Ethiopians | 98.8 /100 | #77 | Exceptional 62.9% |
| Immigrants | Lebanon | 98.8 /100 | #78 | Exceptional 62.9% |
| Northern Europeans | 98.8 /100 | #79 | Exceptional 62.9% |
| Lithuanians | 98.8 /100 | #80 | Exceptional 62.9% |
| Laotians | 98.7 /100 | #81 | Exceptional 62.8% |
| Immigrants | Bolivia | 98.7 /100 | #82 | Exceptional 62.8% |
Demographics Similar to Iranians by College, 1 year or more
In terms of college, 1 year or more, the demographic groups most similar to Iranians are Immigrants from Singapore (70.1%, a difference of 0.22%), Immigrants from Taiwan (69.6%, a difference of 0.49%), Immigrants from India (69.6%, a difference of 0.49%), Immigrants from Iran (69.5%, a difference of 0.70%), and Filipino (71.0%, a difference of 1.4%).
| Demographics | Rating | Rank | College, 1 year or more |
| Filipinos | 100.0 /100 | #1 | Exceptional 71.0% |
| Immigrants | Singapore | 100.0 /100 | #2 | Exceptional 70.1% |
| Iranians | 100.0 /100 | #3 | Exceptional 70.0% |
| Immigrants | Taiwan | 100.0 /100 | #4 | Exceptional 69.6% |
| Immigrants | India | 100.0 /100 | #5 | Exceptional 69.6% |
| Immigrants | Iran | 100.0 /100 | #6 | Exceptional 69.5% |
| Okinawans | 100.0 /100 | #7 | Exceptional 69.0% |
| Thais | 100.0 /100 | #8 | Exceptional 68.6% |
| Immigrants | Israel | 100.0 /100 | #9 | Exceptional 67.8% |
| Immigrants | Australia | 100.0 /100 | #10 | Exceptional 67.7% |
| Immigrants | South Central Asia | 100.0 /100 | #11 | Exceptional 67.1% |
| Cypriots | 100.0 /100 | #12 | Exceptional 67.0% |
| Immigrants | Sweden | 100.0 /100 | #13 | Exceptional 66.8% |
| Burmese | 100.0 /100 | #14 | Exceptional 66.7% |
| Cambodians | 100.0 /100 | #15 | Exceptional 66.7% |