Arapaho vs Immigrants from Israel GED/Equivalency
COMPARE
Arapaho
Immigrants from Israel
GED/Equivalency
GED/Equivalency Comparison
Arapaho
Immigrants from Israel
82.8%
GED/EQUIVALENCY
0.1/ 100
METRIC RATING
277th/ 347
METRIC RANK
88.2%
GED/EQUIVALENCY
99.6/ 100
METRIC RATING
39th/ 347
METRIC RANK
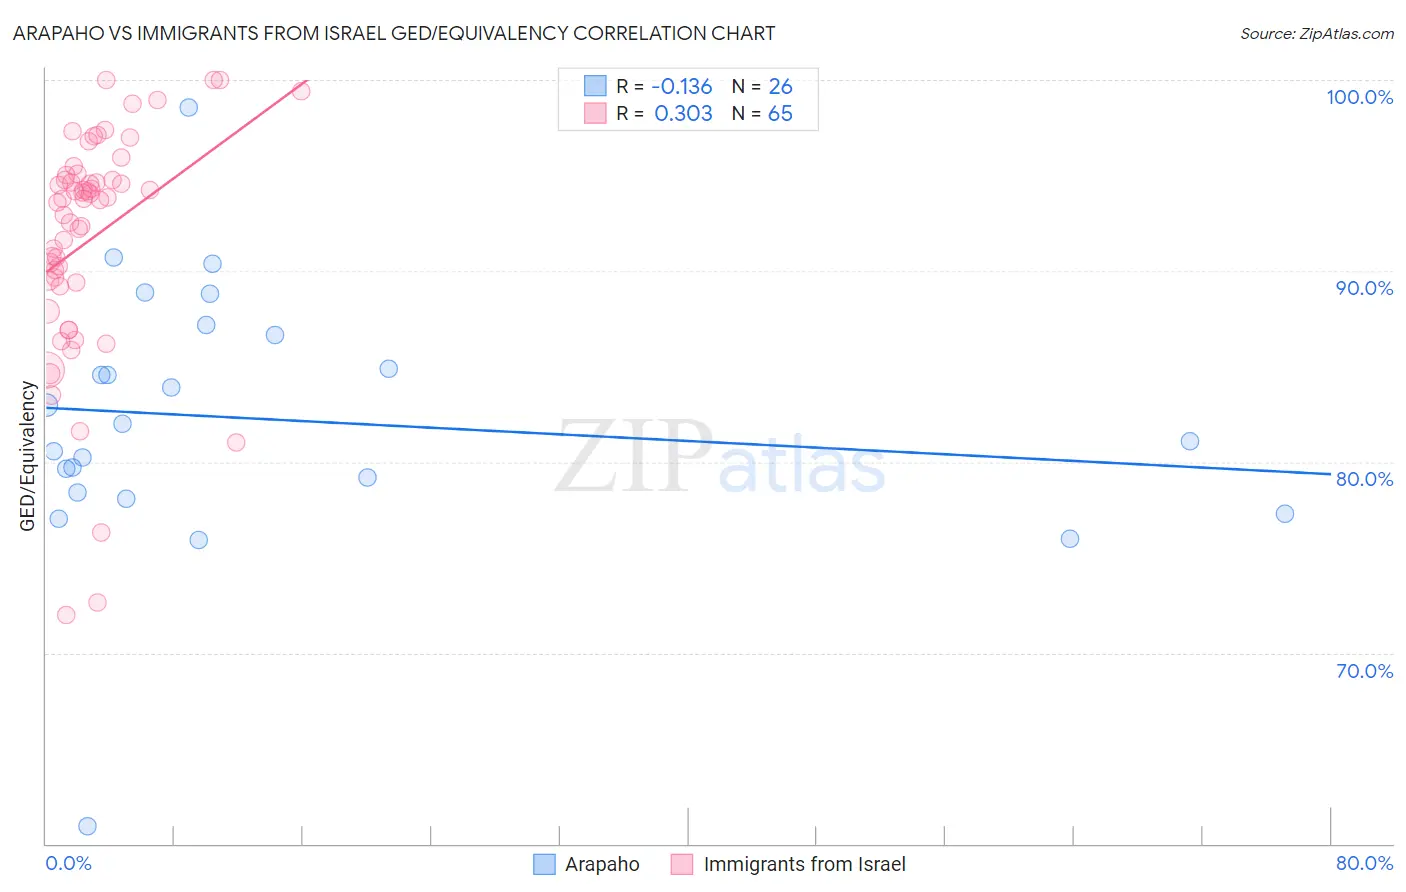
Arapaho vs Immigrants from Israel GED/Equivalency Correlation Chart
The statistical analysis conducted on geographies consisting of 29,780,040 people shows a poor negative correlation between the proportion of Arapaho and percentage of population with at least ged/equivalency education in the United States with a correlation coefficient (R) of -0.136 and weighted average of 82.8%. Similarly, the statistical analysis conducted on geographies consisting of 210,029,020 people shows a mild positive correlation between the proportion of Immigrants from Israel and percentage of population with at least ged/equivalency education in the United States with a correlation coefficient (R) of 0.303 and weighted average of 88.2%, a difference of 6.6%.
GED/Equivalency Correlation Summary
| Measurement | Arapaho | Immigrants from Israel |
| Minimum | 60.9% | 72.0% |
| Maximum | 98.5% | 100.0% |
| Range | 37.6% | 28.0% |
| Mean | 82.2% | 91.7% |
| Median | 81.5% | 93.8% |
| Interquartile 25% (IQ1) | 78.4% | 89.3% |
| Interquartile 75% (IQ3) | 86.6% | 94.9% |
| Interquartile Range (IQR) | 8.2% | 5.6% |
| Standard Deviation (Sample) | 6.9% | 6.0% |
| Standard Deviation (Population) | 6.8% | 6.0% |
Similar Demographics by GED/Equivalency
Demographics Similar to Arapaho by GED/Equivalency
In terms of ged/equivalency, the demographic groups most similar to Arapaho are Black/African American (82.8%, a difference of 0.020%), Immigrants from Laos (82.7%, a difference of 0.030%), Seminole (82.8%, a difference of 0.040%), Immigrants from Fiji (82.7%, a difference of 0.040%), and Cheyenne (82.7%, a difference of 0.050%).
| Demographics | Rating | Rank | GED/Equivalency |
| Immigrants | Jamaica | 0.2 /100 | #270 | Tragic 82.9% |
| U.S. Virgin Islanders | 0.2 /100 | #271 | Tragic 82.9% |
| Barbadians | 0.1 /100 | #272 | Tragic 82.9% |
| Pennsylvania Germans | 0.1 /100 | #273 | Tragic 82.9% |
| Immigrants | Trinidad and Tobago | 0.1 /100 | #274 | Tragic 82.8% |
| Seminole | 0.1 /100 | #275 | Tragic 82.8% |
| Blacks/African Americans | 0.1 /100 | #276 | Tragic 82.8% |
| Arapaho | 0.1 /100 | #277 | Tragic 82.8% |
| Immigrants | Laos | 0.1 /100 | #278 | Tragic 82.7% |
| Immigrants | Fiji | 0.1 /100 | #279 | Tragic 82.7% |
| Cheyenne | 0.1 /100 | #280 | Tragic 82.7% |
| Sioux | 0.1 /100 | #281 | Tragic 82.6% |
| Immigrants | Immigrants | 0.1 /100 | #282 | Tragic 82.6% |
| Indonesians | 0.1 /100 | #283 | Tragic 82.5% |
| Immigrants | Barbados | 0.1 /100 | #284 | Tragic 82.4% |
Demographics Similar to Immigrants from Israel by GED/Equivalency
In terms of ged/equivalency, the demographic groups most similar to Immigrants from Israel are Italian (88.2%, a difference of 0.020%), Finnish (88.2%, a difference of 0.030%), Cambodian (88.2%, a difference of 0.060%), Immigrants from Scotland (88.2%, a difference of 0.070%), and Burmese (88.3%, a difference of 0.090%).
| Demographics | Rating | Rank | GED/Equivalency |
| Danes | 99.8 /100 | #32 | Exceptional 88.4% |
| Immigrants | Sweden | 99.7 /100 | #33 | Exceptional 88.4% |
| Immigrants | Japan | 99.7 /100 | #34 | Exceptional 88.4% |
| Immigrants | South Central Asia | 99.7 /100 | #35 | Exceptional 88.4% |
| Immigrants | Belgium | 99.7 /100 | #36 | Exceptional 88.3% |
| Immigrants | Austria | 99.7 /100 | #37 | Exceptional 88.3% |
| Burmese | 99.7 /100 | #38 | Exceptional 88.3% |
| Immigrants | Israel | 99.6 /100 | #39 | Exceptional 88.2% |
| Italians | 99.6 /100 | #40 | Exceptional 88.2% |
| Finns | 99.6 /100 | #41 | Exceptional 88.2% |
| Cambodians | 99.6 /100 | #42 | Exceptional 88.2% |
| Immigrants | Scotland | 99.6 /100 | #43 | Exceptional 88.2% |
| Macedonians | 99.5 /100 | #44 | Exceptional 88.1% |
| Czechs | 99.5 /100 | #45 | Exceptional 88.1% |
| Immigrants | Switzerland | 99.5 /100 | #46 | Exceptional 88.1% |