Immigrants from Moldova vs Ecuadorian College, Under 1 year
COMPARE
Immigrants from Moldova
Ecuadorian
College, Under 1 year
College, Under 1 year Comparison
Immigrants from Moldova
Ecuadorians
69.0%
COLLEGE, UNDER 1 YEAR
99.3/ 100
METRIC RATING
65th/ 347
METRIC RANK
59.3%
COLLEGE, UNDER 1 YEAR
0.0/ 100
METRIC RATING
290th/ 347
METRIC RANK
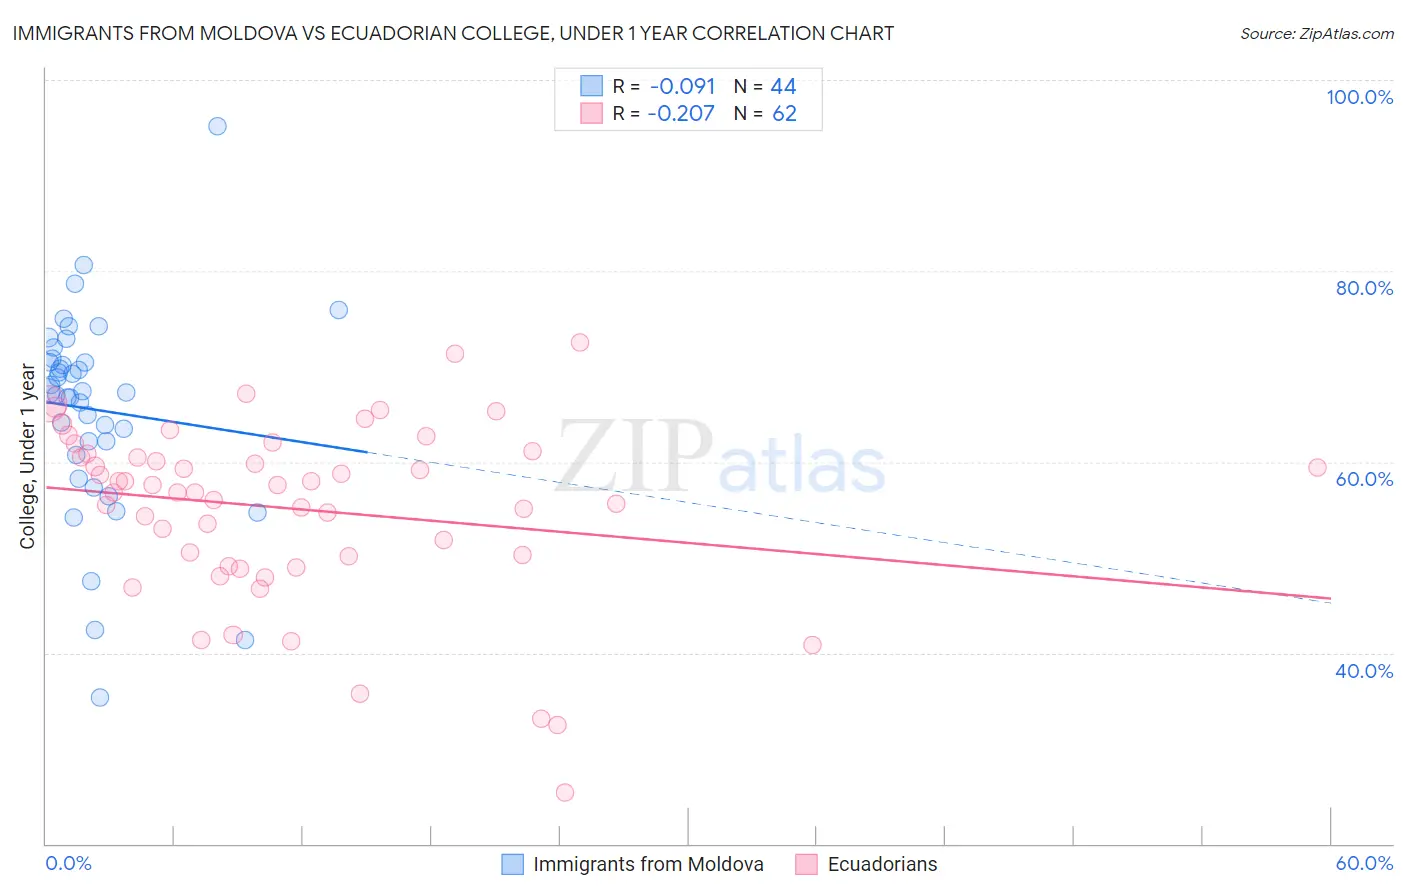
Immigrants from Moldova vs Ecuadorian College, Under 1 year Correlation Chart
The statistical analysis conducted on geographies consisting of 124,401,069 people shows a slight negative correlation between the proportion of Immigrants from Moldova and percentage of population with at least college, under 1 year education in the United States with a correlation coefficient (R) of -0.091 and weighted average of 69.0%. Similarly, the statistical analysis conducted on geographies consisting of 317,865,755 people shows a weak negative correlation between the proportion of Ecuadorians and percentage of population with at least college, under 1 year education in the United States with a correlation coefficient (R) of -0.207 and weighted average of 59.3%, a difference of 16.4%.
College, Under 1 year Correlation Summary
| Measurement | Immigrants from Moldova | Ecuadorian |
| Minimum | 35.3% | 25.4% |
| Maximum | 95.2% | 72.5% |
| Range | 59.9% | 47.2% |
| Mean | 65.5% | 55.1% |
| Median | 67.3% | 57.2% |
| Interquartile 25% (IQ1) | 61.4% | 50.1% |
| Interquartile 75% (IQ3) | 70.6% | 60.9% |
| Interquartile Range (IQR) | 9.2% | 10.8% |
| Standard Deviation (Sample) | 10.7% | 9.4% |
| Standard Deviation (Population) | 10.6% | 9.3% |
Similar Demographics by College, Under 1 year
Demographics Similar to Immigrants from Moldova by College, Under 1 year
In terms of college, under 1 year, the demographic groups most similar to Immigrants from Moldova are Northern European (69.0%, a difference of 0.020%), Immigrants from North America (69.0%, a difference of 0.030%), Immigrants from Canada (69.1%, a difference of 0.060%), Immigrants from Zimbabwe (68.9%, a difference of 0.17%), and Immigrants from Kazakhstan (69.2%, a difference of 0.19%).
| Demographics | Rating | Rank | College, Under 1 year |
| Immigrants | Malaysia | 99.6 /100 | #58 | Exceptional 69.3% |
| Immigrants | Serbia | 99.5 /100 | #59 | Exceptional 69.3% |
| Immigrants | Asia | 99.5 /100 | #60 | Exceptional 69.2% |
| Immigrants | Kazakhstan | 99.5 /100 | #61 | Exceptional 69.2% |
| Immigrants | Belarus | 99.5 /100 | #62 | Exceptional 69.2% |
| Immigrants | Canada | 99.4 /100 | #63 | Exceptional 69.1% |
| Northern Europeans | 99.4 /100 | #64 | Exceptional 69.0% |
| Immigrants | Moldova | 99.3 /100 | #65 | Exceptional 69.0% |
| Immigrants | North America | 99.3 /100 | #66 | Exceptional 69.0% |
| Immigrants | Zimbabwe | 99.2 /100 | #67 | Exceptional 68.9% |
| Immigrants | Indonesia | 99.2 /100 | #68 | Exceptional 68.9% |
| Immigrants | Romania | 99.2 /100 | #69 | Exceptional 68.9% |
| Lithuanians | 99.1 /100 | #70 | Exceptional 68.8% |
| Immigrants | Europe | 99.1 /100 | #71 | Exceptional 68.8% |
| Bolivians | 99.0 /100 | #72 | Exceptional 68.7% |
Demographics Similar to Ecuadorians by College, Under 1 year
In terms of college, under 1 year, the demographic groups most similar to Ecuadorians are Choctaw (59.3%, a difference of 0.040%), Creek (59.3%, a difference of 0.090%), Black/African American (59.4%, a difference of 0.11%), Nicaraguan (59.2%, a difference of 0.13%), and Sioux (59.4%, a difference of 0.21%).
| Demographics | Rating | Rank | College, Under 1 year |
| Immigrants | Jamaica | 0.0 /100 | #283 | Tragic 59.7% |
| Immigrants | St. Vincent and the Grenadines | 0.0 /100 | #284 | Tragic 59.6% |
| Paiute | 0.0 /100 | #285 | Tragic 59.6% |
| British West Indians | 0.0 /100 | #286 | Tragic 59.5% |
| Sioux | 0.0 /100 | #287 | Tragic 59.4% |
| Blacks/African Americans | 0.0 /100 | #288 | Tragic 59.4% |
| Choctaw | 0.0 /100 | #289 | Tragic 59.3% |
| Ecuadorians | 0.0 /100 | #290 | Tragic 59.3% |
| Creek | 0.0 /100 | #291 | Tragic 59.3% |
| Nicaraguans | 0.0 /100 | #292 | Tragic 59.2% |
| Seminole | 0.0 /100 | #293 | Tragic 59.1% |
| Immigrants | Belize | 0.0 /100 | #294 | Tragic 59.1% |
| Immigrants | Grenada | 0.0 /100 | #295 | Tragic 59.1% |
| Central American Indians | 0.0 /100 | #296 | Tragic 59.0% |
| Guyanese | 0.0 /100 | #297 | Tragic 59.0% |