Immigrants from Bangladesh vs Ecuadorian College, Under 1 year
COMPARE
Immigrants from Bangladesh
Ecuadorian
College, Under 1 year
College, Under 1 year Comparison
Immigrants from Bangladesh
Ecuadorians
61.3%
COLLEGE, UNDER 1 YEAR
0.3/ 100
METRIC RATING
258th/ 347
METRIC RANK
59.3%
COLLEGE, UNDER 1 YEAR
0.0/ 100
METRIC RATING
290th/ 347
METRIC RANK
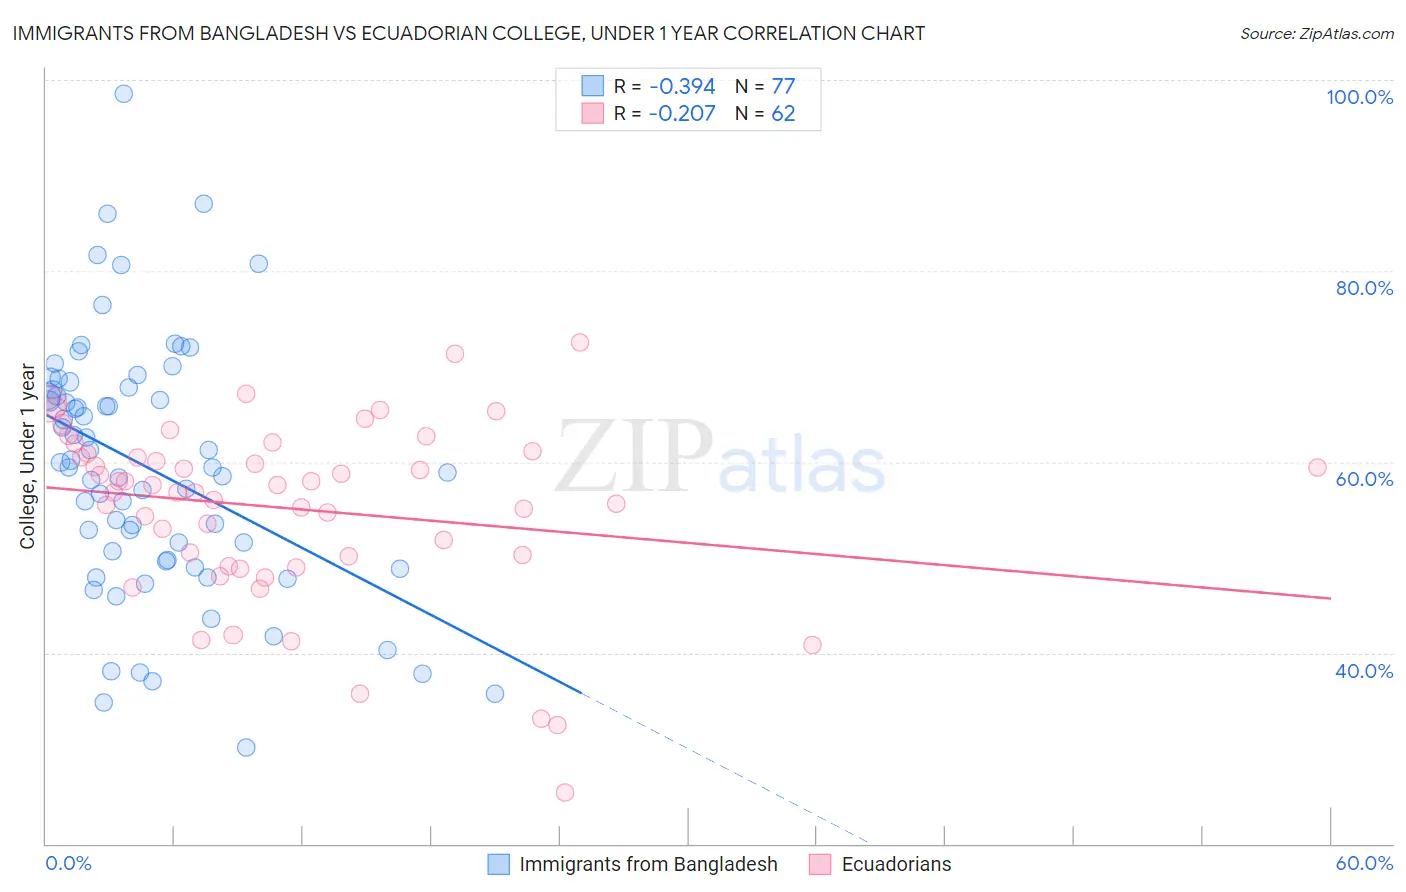
Immigrants from Bangladesh vs Ecuadorian College, Under 1 year Correlation Chart
The statistical analysis conducted on geographies consisting of 203,680,658 people shows a mild negative correlation between the proportion of Immigrants from Bangladesh and percentage of population with at least college, under 1 year education in the United States with a correlation coefficient (R) of -0.394 and weighted average of 61.3%. Similarly, the statistical analysis conducted on geographies consisting of 317,865,755 people shows a weak negative correlation between the proportion of Ecuadorians and percentage of population with at least college, under 1 year education in the United States with a correlation coefficient (R) of -0.207 and weighted average of 59.3%, a difference of 3.3%.
College, Under 1 year Correlation Summary
| Measurement | Immigrants from Bangladesh | Ecuadorian |
| Minimum | 30.1% | 25.4% |
| Maximum | 98.6% | 72.5% |
| Range | 68.5% | 47.2% |
| Mean | 59.4% | 55.1% |
| Median | 59.4% | 57.2% |
| Interquartile 25% (IQ1) | 49.6% | 50.1% |
| Interquartile 75% (IQ3) | 67.7% | 60.9% |
| Interquartile Range (IQR) | 18.1% | 10.8% |
| Standard Deviation (Sample) | 13.2% | 9.4% |
| Standard Deviation (Population) | 13.1% | 9.3% |
Similar Demographics by College, Under 1 year
Demographics Similar to Immigrants from Bangladesh by College, Under 1 year
In terms of college, under 1 year, the demographic groups most similar to Immigrants from Bangladesh are Indonesian (61.2%, a difference of 0.020%), Immigrants from Laos (61.3%, a difference of 0.060%), Bangladeshi (61.4%, a difference of 0.17%), Blackfeet (61.1%, a difference of 0.19%), and Comanche (61.4%, a difference of 0.22%).
| Demographics | Rating | Rank | College, Under 1 year |
| Immigrants | Micronesia | 0.5 /100 | #251 | Tragic 61.5% |
| West Indians | 0.4 /100 | #252 | Tragic 61.5% |
| Japanese | 0.4 /100 | #253 | Tragic 61.5% |
| Immigrants | Cambodia | 0.4 /100 | #254 | Tragic 61.5% |
| Comanche | 0.4 /100 | #255 | Tragic 61.4% |
| Bangladeshis | 0.4 /100 | #256 | Tragic 61.4% |
| Immigrants | Laos | 0.3 /100 | #257 | Tragic 61.3% |
| Immigrants | Bangladesh | 0.3 /100 | #258 | Tragic 61.3% |
| Indonesians | 0.3 /100 | #259 | Tragic 61.2% |
| Blackfeet | 0.3 /100 | #260 | Tragic 61.1% |
| Africans | 0.3 /100 | #261 | Tragic 61.1% |
| Barbadians | 0.2 /100 | #262 | Tragic 61.1% |
| Shoshone | 0.2 /100 | #263 | Tragic 61.1% |
| Trinidadians and Tobagonians | 0.2 /100 | #264 | Tragic 61.1% |
| Immigrants | Bahamas | 0.2 /100 | #265 | Tragic 61.1% |
Demographics Similar to Ecuadorians by College, Under 1 year
In terms of college, under 1 year, the demographic groups most similar to Ecuadorians are Choctaw (59.3%, a difference of 0.040%), Creek (59.3%, a difference of 0.090%), Black/African American (59.4%, a difference of 0.11%), Nicaraguan (59.2%, a difference of 0.13%), and Sioux (59.4%, a difference of 0.21%).
| Demographics | Rating | Rank | College, Under 1 year |
| Immigrants | Jamaica | 0.0 /100 | #283 | Tragic 59.7% |
| Immigrants | St. Vincent and the Grenadines | 0.0 /100 | #284 | Tragic 59.6% |
| Paiute | 0.0 /100 | #285 | Tragic 59.6% |
| British West Indians | 0.0 /100 | #286 | Tragic 59.5% |
| Sioux | 0.0 /100 | #287 | Tragic 59.4% |
| Blacks/African Americans | 0.0 /100 | #288 | Tragic 59.4% |
| Choctaw | 0.0 /100 | #289 | Tragic 59.3% |
| Ecuadorians | 0.0 /100 | #290 | Tragic 59.3% |
| Creek | 0.0 /100 | #291 | Tragic 59.3% |
| Nicaraguans | 0.0 /100 | #292 | Tragic 59.2% |
| Seminole | 0.0 /100 | #293 | Tragic 59.1% |
| Immigrants | Belize | 0.0 /100 | #294 | Tragic 59.1% |
| Immigrants | Grenada | 0.0 /100 | #295 | Tragic 59.1% |
| Central American Indians | 0.0 /100 | #296 | Tragic 59.0% |
| Guyanese | 0.0 /100 | #297 | Tragic 59.0% |