Apache vs Pueblo Professional Degree
COMPARE
Apache
Pueblo
Professional Degree
Professional Degree Comparison
Apache
Pueblo
3.5%
PROFESSIONAL DEGREE
0.5/ 100
METRIC RATING
281st/ 347
METRIC RANK
3.7%
PROFESSIONAL DEGREE
1.4/ 100
METRIC RATING
253rd/ 347
METRIC RANK
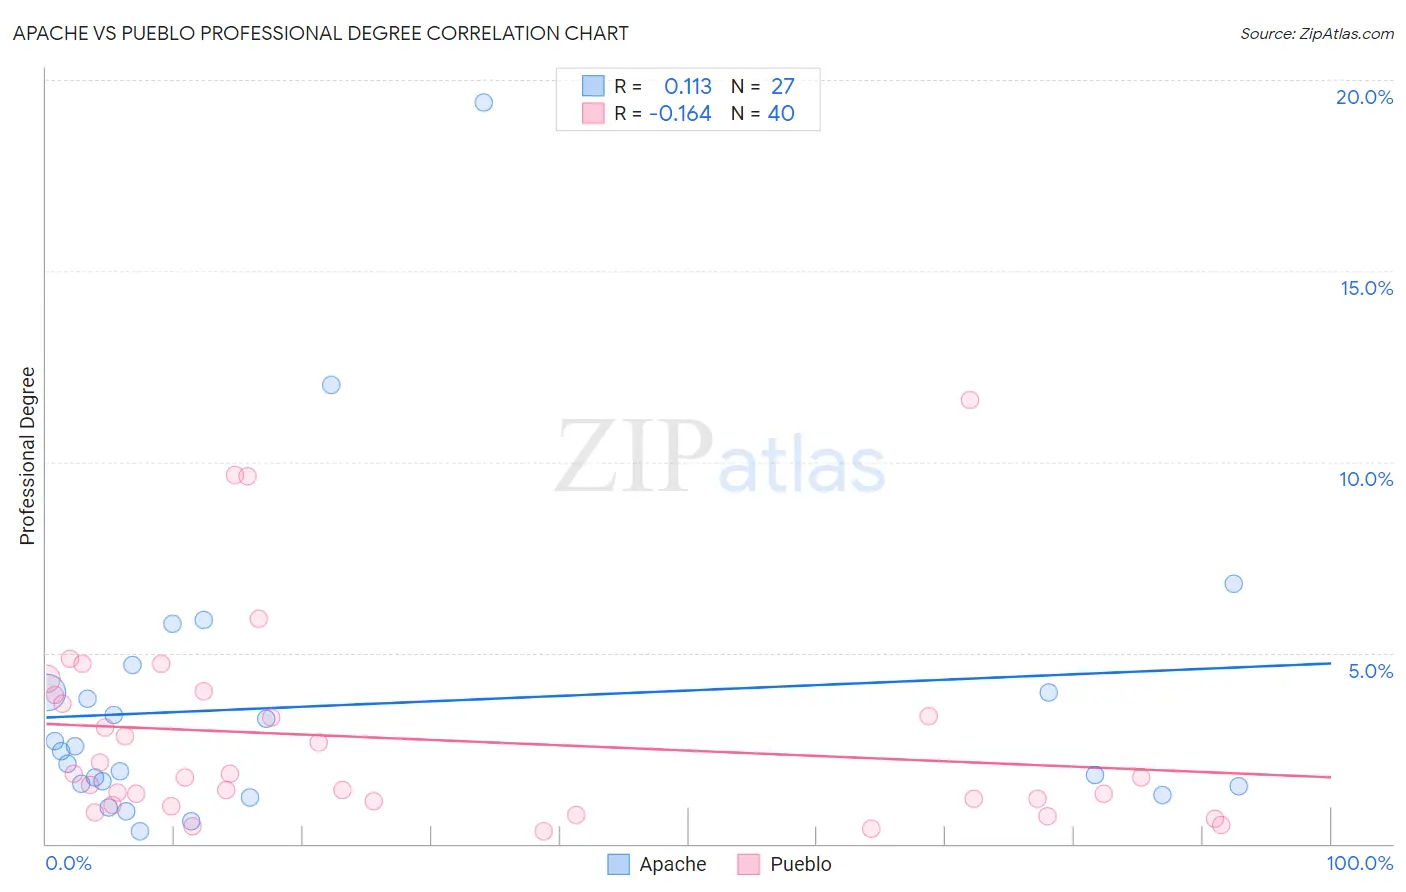
Apache vs Pueblo Professional Degree Correlation Chart
The statistical analysis conducted on geographies consisting of 230,302,236 people shows a poor positive correlation between the proportion of Apache and percentage of population with at least professional degree education in the United States with a correlation coefficient (R) of 0.113 and weighted average of 3.5%. Similarly, the statistical analysis conducted on geographies consisting of 119,857,824 people shows a poor negative correlation between the proportion of Pueblo and percentage of population with at least professional degree education in the United States with a correlation coefficient (R) of -0.164 and weighted average of 3.7%, a difference of 5.0%.
Professional Degree Correlation Summary
| Measurement | Apache | Pueblo |
| Minimum | 0.33% | 0.33% |
| Maximum | 19.4% | 11.6% |
| Range | 19.1% | 11.3% |
| Mean | 3.6% | 2.7% |
| Median | 2.4% | 1.7% |
| Interquartile 25% (IQ1) | 1.5% | 1.1% |
| Interquartile 75% (IQ3) | 4.0% | 3.8% |
| Interquartile Range (IQR) | 2.5% | 2.7% |
| Standard Deviation (Sample) | 4.0% | 2.6% |
| Standard Deviation (Population) | 3.9% | 2.6% |
Similar Demographics by Professional Degree
Demographics Similar to Apache by Professional Degree
In terms of professional degree, the demographic groups most similar to Apache are Immigrants from Caribbean (3.5%, a difference of 0.020%), Dominican (3.5%, a difference of 0.030%), Immigrants from Portugal (3.5%, a difference of 0.060%), Japanese (3.5%, a difference of 0.10%), and Cheyenne (3.6%, a difference of 0.16%).
| Demographics | Rating | Rank | Professional Degree |
| Potawatomi | 0.5 /100 | #274 | Tragic 3.6% |
| Immigrants | Dominica | 0.5 /100 | #275 | Tragic 3.6% |
| Liberians | 0.5 /100 | #276 | Tragic 3.6% |
| Cheyenne | 0.5 /100 | #277 | Tragic 3.6% |
| Japanese | 0.5 /100 | #278 | Tragic 3.5% |
| Immigrants | Portugal | 0.5 /100 | #279 | Tragic 3.5% |
| Dominicans | 0.5 /100 | #280 | Tragic 3.5% |
| Apache | 0.5 /100 | #281 | Tragic 3.5% |
| Immigrants | Caribbean | 0.5 /100 | #282 | Tragic 3.5% |
| Comanche | 0.4 /100 | #283 | Tragic 3.5% |
| Salvadorans | 0.4 /100 | #284 | Tragic 3.5% |
| Hondurans | 0.3 /100 | #285 | Tragic 3.5% |
| Haitians | 0.3 /100 | #286 | Tragic 3.5% |
| Immigrants | El Salvador | 0.3 /100 | #287 | Tragic 3.5% |
| Blackfeet | 0.3 /100 | #288 | Tragic 3.5% |
Demographics Similar to Pueblo by Professional Degree
In terms of professional degree, the demographic groups most similar to Pueblo are Jamaican (3.7%, a difference of 0.10%), Tongan (3.7%, a difference of 0.14%), Immigrants from Nicaragua (3.7%, a difference of 0.24%), Immigrants from Fiji (3.7%, a difference of 0.50%), and Immigrants from Grenada (3.7%, a difference of 0.56%).
| Demographics | Rating | Rank | Professional Degree |
| Marshallese | 1.7 /100 | #246 | Tragic 3.8% |
| Guyanese | 1.6 /100 | #247 | Tragic 3.8% |
| Hmong | 1.6 /100 | #248 | Tragic 3.7% |
| Immigrants | Grenada | 1.5 /100 | #249 | Tragic 3.7% |
| Immigrants | Fiji | 1.5 /100 | #250 | Tragic 3.7% |
| Immigrants | Nicaragua | 1.4 /100 | #251 | Tragic 3.7% |
| Jamaicans | 1.4 /100 | #252 | Tragic 3.7% |
| Pueblo | 1.4 /100 | #253 | Tragic 3.7% |
| Tongans | 1.3 /100 | #254 | Tragic 3.7% |
| Osage | 1.2 /100 | #255 | Tragic 3.7% |
| Iroquois | 1.2 /100 | #256 | Tragic 3.7% |
| Bahamians | 1.1 /100 | #257 | Tragic 3.7% |
| Immigrants | St. Vincent and the Grenadines | 1.1 /100 | #258 | Tragic 3.7% |
| Africans | 1.0 /100 | #259 | Tragic 3.7% |
| Indonesians | 1.0 /100 | #260 | Tragic 3.7% |