Korean vs Pueblo College, Under 1 year
COMPARE
Korean
Pueblo
College, Under 1 year
College, Under 1 year Comparison
Koreans
Pueblo
65.9%
COLLEGE, UNDER 1 YEAR
65.3/ 100
METRIC RATING
162nd/ 347
METRIC RANK
57.4%
COLLEGE, UNDER 1 YEAR
0.0/ 100
METRIC RATING
310th/ 347
METRIC RANK
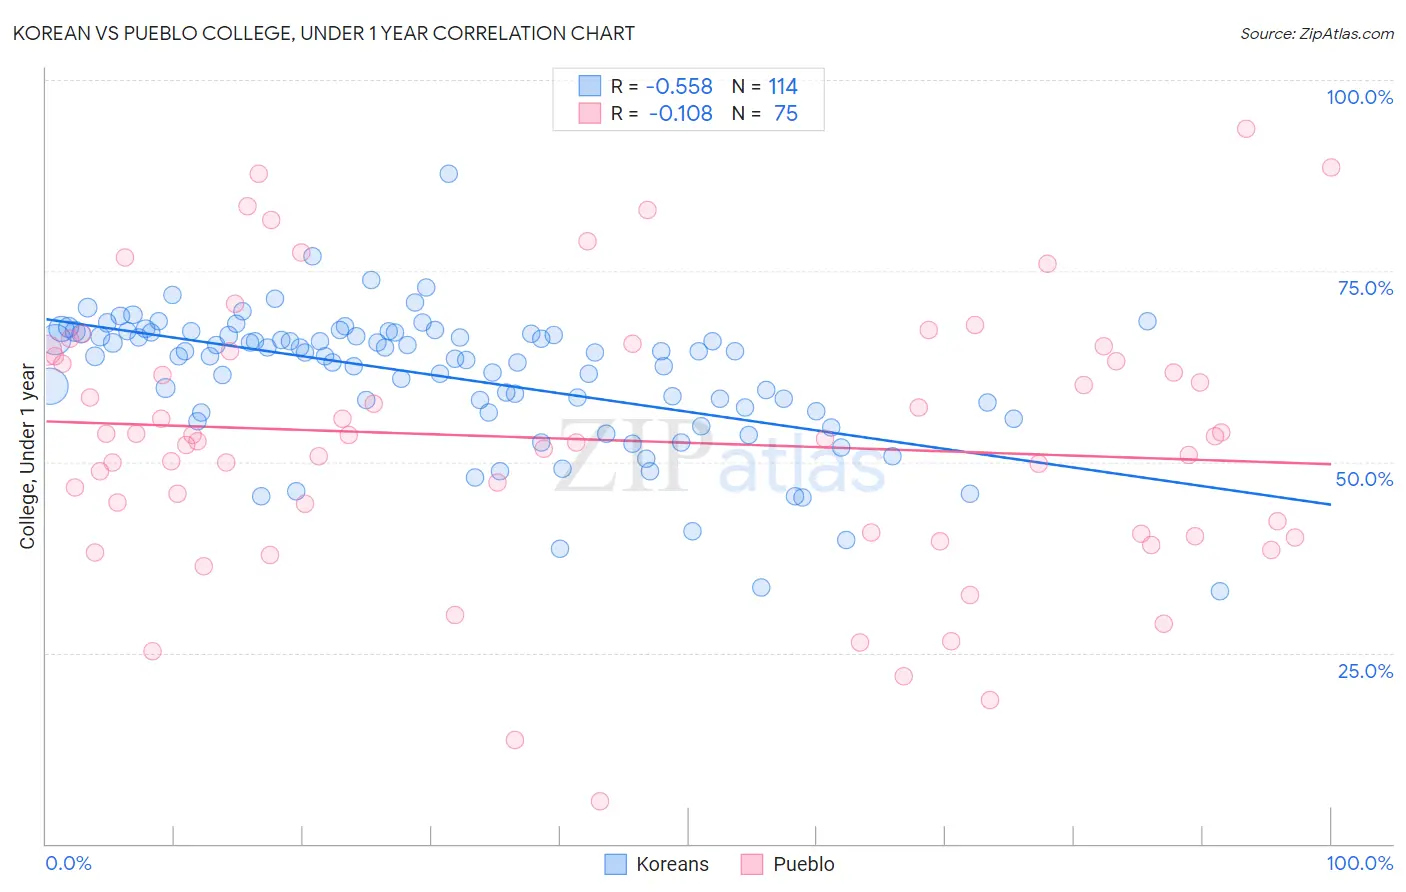
Korean vs Pueblo College, Under 1 year Correlation Chart
The statistical analysis conducted on geographies consisting of 510,944,501 people shows a substantial negative correlation between the proportion of Koreans and percentage of population with at least college, under 1 year education in the United States with a correlation coefficient (R) of -0.558 and weighted average of 65.9%. Similarly, the statistical analysis conducted on geographies consisting of 120,087,269 people shows a poor negative correlation between the proportion of Pueblo and percentage of population with at least college, under 1 year education in the United States with a correlation coefficient (R) of -0.108 and weighted average of 57.4%, a difference of 14.8%.
College, Under 1 year Correlation Summary
| Measurement | Korean | Pueblo |
| Minimum | 33.0% | 5.6% |
| Maximum | 87.8% | 93.5% |
| Range | 54.8% | 88.0% |
| Mean | 61.2% | 52.9% |
| Median | 64.1% | 53.0% |
| Interquartile 25% (IQ1) | 56.5% | 40.5% |
| Interquartile 75% (IQ3) | 66.8% | 64.5% |
| Interquartile Range (IQR) | 10.2% | 23.9% |
| Standard Deviation (Sample) | 8.9% | 17.8% |
| Standard Deviation (Population) | 8.8% | 17.7% |
Similar Demographics by College, Under 1 year
Demographics Similar to Koreans by College, Under 1 year
In terms of college, under 1 year, the demographic groups most similar to Koreans are Brazilian (65.9%, a difference of 0.030%), Albanian (65.9%, a difference of 0.040%), Tlingit-Haida (65.9%, a difference of 0.050%), Celtic (65.9%, a difference of 0.10%), and Somali (65.8%, a difference of 0.12%).
| Demographics | Rating | Rank | College, Under 1 year |
| Irish | 70.3 /100 | #155 | Good 66.0% |
| Welsh | 69.9 /100 | #156 | Good 66.0% |
| Sierra Leoneans | 67.8 /100 | #157 | Good 66.0% |
| Celtics | 67.3 /100 | #158 | Good 65.9% |
| Tlingit-Haida | 66.4 /100 | #159 | Good 65.9% |
| Albanians | 66.1 /100 | #160 | Good 65.9% |
| Brazilians | 66.0 /100 | #161 | Good 65.9% |
| Koreans | 65.3 /100 | #162 | Good 65.9% |
| Somalis | 62.7 /100 | #163 | Good 65.8% |
| Czechoslovakians | 62.6 /100 | #164 | Good 65.8% |
| Immigrants | Uzbekistan | 61.6 /100 | #165 | Good 65.8% |
| Moroccans | 56.7 /100 | #166 | Average 65.6% |
| Immigrants | Somalia | 56.4 /100 | #167 | Average 65.6% |
| Hungarians | 55.9 /100 | #168 | Average 65.6% |
| Yugoslavians | 55.7 /100 | #169 | Average 65.6% |
Demographics Similar to Pueblo by College, Under 1 year
In terms of college, under 1 year, the demographic groups most similar to Pueblo are Cajun (57.3%, a difference of 0.060%), Salvadoran (57.3%, a difference of 0.12%), Dutch West Indian (57.2%, a difference of 0.36%), Immigrants from Nicaragua (57.6%, a difference of 0.39%), and Hopi (57.1%, a difference of 0.48%).
| Demographics | Rating | Rank | College, Under 1 year |
| Immigrants | Dominica | 0.0 /100 | #303 | Tragic 57.9% |
| Kiowa | 0.0 /100 | #304 | Tragic 57.8% |
| Haitians | 0.0 /100 | #305 | Tragic 57.8% |
| Immigrants | Portugal | 0.0 /100 | #306 | Tragic 57.7% |
| Fijians | 0.0 /100 | #307 | Tragic 57.7% |
| Central Americans | 0.0 /100 | #308 | Tragic 57.7% |
| Immigrants | Nicaragua | 0.0 /100 | #309 | Tragic 57.6% |
| Pueblo | 0.0 /100 | #310 | Tragic 57.4% |
| Cajuns | 0.0 /100 | #311 | Tragic 57.3% |
| Salvadorans | 0.0 /100 | #312 | Tragic 57.3% |
| Dutch West Indians | 0.0 /100 | #313 | Tragic 57.2% |
| Hopi | 0.0 /100 | #314 | Tragic 57.1% |
| Hondurans | 0.0 /100 | #315 | Tragic 57.1% |
| Menominee | 0.0 /100 | #316 | Tragic 57.0% |
| Hispanics or Latinos | 0.0 /100 | #317 | Tragic 57.0% |