Immigrants from Bangladesh vs Immigrants from Dominican Republic Doctorate Degree
COMPARE
Immigrants from Bangladesh
Immigrants from Dominican Republic
Doctorate Degree
Doctorate Degree Comparison
Immigrants from Bangladesh
Immigrants from Dominican Republic
1.8%
DOCTORATE DEGREE
50.0/ 100
METRIC RATING
174th/ 347
METRIC RANK
1.3%
DOCTORATE DEGREE
0.0/ 100
METRIC RATING
334th/ 347
METRIC RANK
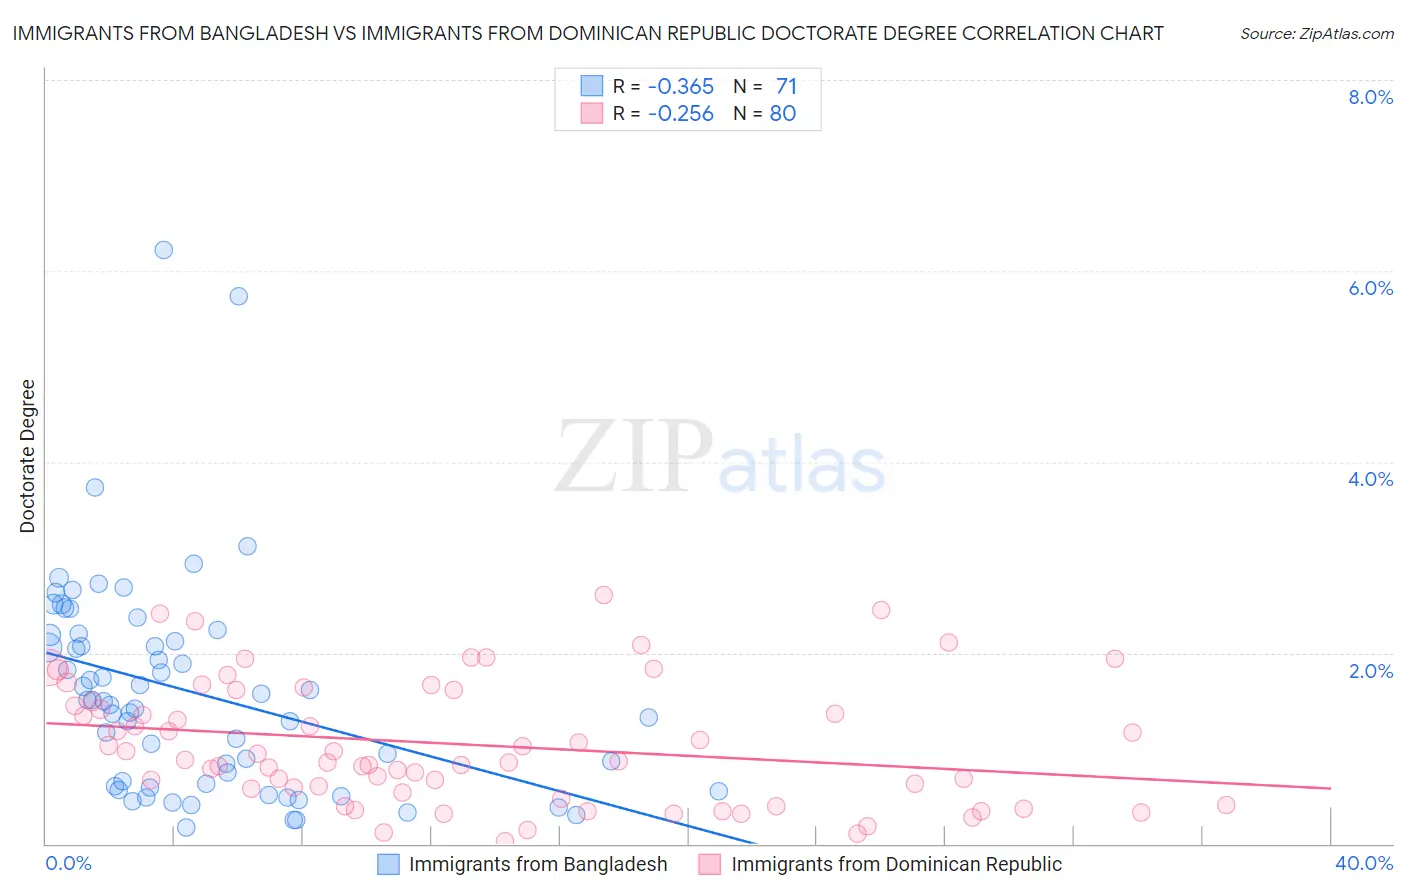
Immigrants from Bangladesh vs Immigrants from Dominican Republic Doctorate Degree Correlation Chart
The statistical analysis conducted on geographies consisting of 203,048,073 people shows a mild negative correlation between the proportion of Immigrants from Bangladesh and percentage of population with at least doctorate degree education in the United States with a correlation coefficient (R) of -0.365 and weighted average of 1.8%. Similarly, the statistical analysis conducted on geographies consisting of 273,260,616 people shows a weak negative correlation between the proportion of Immigrants from Dominican Republic and percentage of population with at least doctorate degree education in the United States with a correlation coefficient (R) of -0.256 and weighted average of 1.3%, a difference of 43.8%.
Doctorate Degree Correlation Summary
| Measurement | Immigrants from Bangladesh | Immigrants from Dominican Republic |
| Minimum | 0.17% | 0.033% |
| Maximum | 6.2% | 2.6% |
| Range | 6.0% | 2.6% |
| Mean | 1.6% | 1.0% |
| Median | 1.5% | 0.87% |
| Interquartile 25% (IQ1) | 0.60% | 0.56% |
| Interquartile 75% (IQ3) | 2.2% | 1.5% |
| Interquartile Range (IQR) | 1.6% | 0.99% |
| Standard Deviation (Sample) | 1.1% | 0.64% |
| Standard Deviation (Population) | 1.1% | 0.64% |
Similar Demographics by Doctorate Degree
Demographics Similar to Immigrants from Bangladesh by Doctorate Degree
In terms of doctorate degree, the demographic groups most similar to Immigrants from Bangladesh are Norwegian (1.8%, a difference of 0.0%), Belgian (1.8%, a difference of 0.040%), Immigrants from Thailand (1.8%, a difference of 0.080%), Spanish (1.8%, a difference of 0.10%), and Iraqi (1.8%, a difference of 0.11%).
| Demographics | Rating | Rank | Doctorate Degree |
| Macedonians | 60.9 /100 | #167 | Good 1.9% |
| Sri Lankans | 60.3 /100 | #168 | Good 1.9% |
| Vietnamese | 54.8 /100 | #169 | Average 1.9% |
| Costa Ricans | 53.3 /100 | #170 | Average 1.8% |
| Bermudans | 52.1 /100 | #171 | Average 1.8% |
| Belgians | 50.3 /100 | #172 | Average 1.8% |
| Norwegians | 50.0 /100 | #173 | Average 1.8% |
| Immigrants | Bangladesh | 50.0 /100 | #174 | Average 1.8% |
| Immigrants | Thailand | 49.4 /100 | #175 | Average 1.8% |
| Spanish | 49.3 /100 | #176 | Average 1.8% |
| Iraqis | 49.2 /100 | #177 | Average 1.8% |
| French | 48.8 /100 | #178 | Average 1.8% |
| Ghanaians | 48.3 /100 | #179 | Average 1.8% |
| Scandinavians | 48.0 /100 | #180 | Average 1.8% |
| Immigrants | Immigrants | 46.2 /100 | #181 | Average 1.8% |
Demographics Similar to Immigrants from Dominican Republic by Doctorate Degree
In terms of doctorate degree, the demographic groups most similar to Immigrants from Dominican Republic are Immigrants from Caribbean (1.3%, a difference of 0.19%), Yakama (1.3%, a difference of 0.35%), Immigrants from Haiti (1.3%, a difference of 1.8%), Immigrants from Latin America (1.3%, a difference of 1.9%), and Yup'ik (1.3%, a difference of 1.9%).
| Demographics | Rating | Rank | Doctorate Degree |
| Hispanics or Latinos | 0.0 /100 | #327 | Tragic 1.3% |
| Inupiat | 0.0 /100 | #328 | Tragic 1.3% |
| Haitians | 0.0 /100 | #329 | Tragic 1.3% |
| Yup'ik | 0.0 /100 | #330 | Tragic 1.3% |
| Immigrants | Latin America | 0.0 /100 | #331 | Tragic 1.3% |
| Yakama | 0.0 /100 | #332 | Tragic 1.3% |
| Immigrants | Caribbean | 0.0 /100 | #333 | Tragic 1.3% |
| Immigrants | Dominican Republic | 0.0 /100 | #334 | Tragic 1.3% |
| Immigrants | Haiti | 0.0 /100 | #335 | Tragic 1.3% |
| Nepalese | 0.0 /100 | #336 | Tragic 1.3% |
| Bangladeshis | 0.0 /100 | #337 | Tragic 1.2% |
| Puget Sound Salish | 0.0 /100 | #338 | Tragic 1.2% |
| Immigrants | Central America | 0.0 /100 | #339 | Tragic 1.2% |
| Immigrants | Cuba | 0.0 /100 | #340 | Tragic 1.2% |
| Mexicans | 0.0 /100 | #341 | Tragic 1.2% |