Salvadoran vs Immigrants from Dominican Republic Doctorate Degree
COMPARE
Salvadoran
Immigrants from Dominican Republic
Doctorate Degree
Doctorate Degree Comparison
Salvadorans
Immigrants from Dominican Republic
1.5%
DOCTORATE DEGREE
0.5/ 100
METRIC RATING
270th/ 347
METRIC RANK
1.3%
DOCTORATE DEGREE
0.0/ 100
METRIC RATING
334th/ 347
METRIC RANK
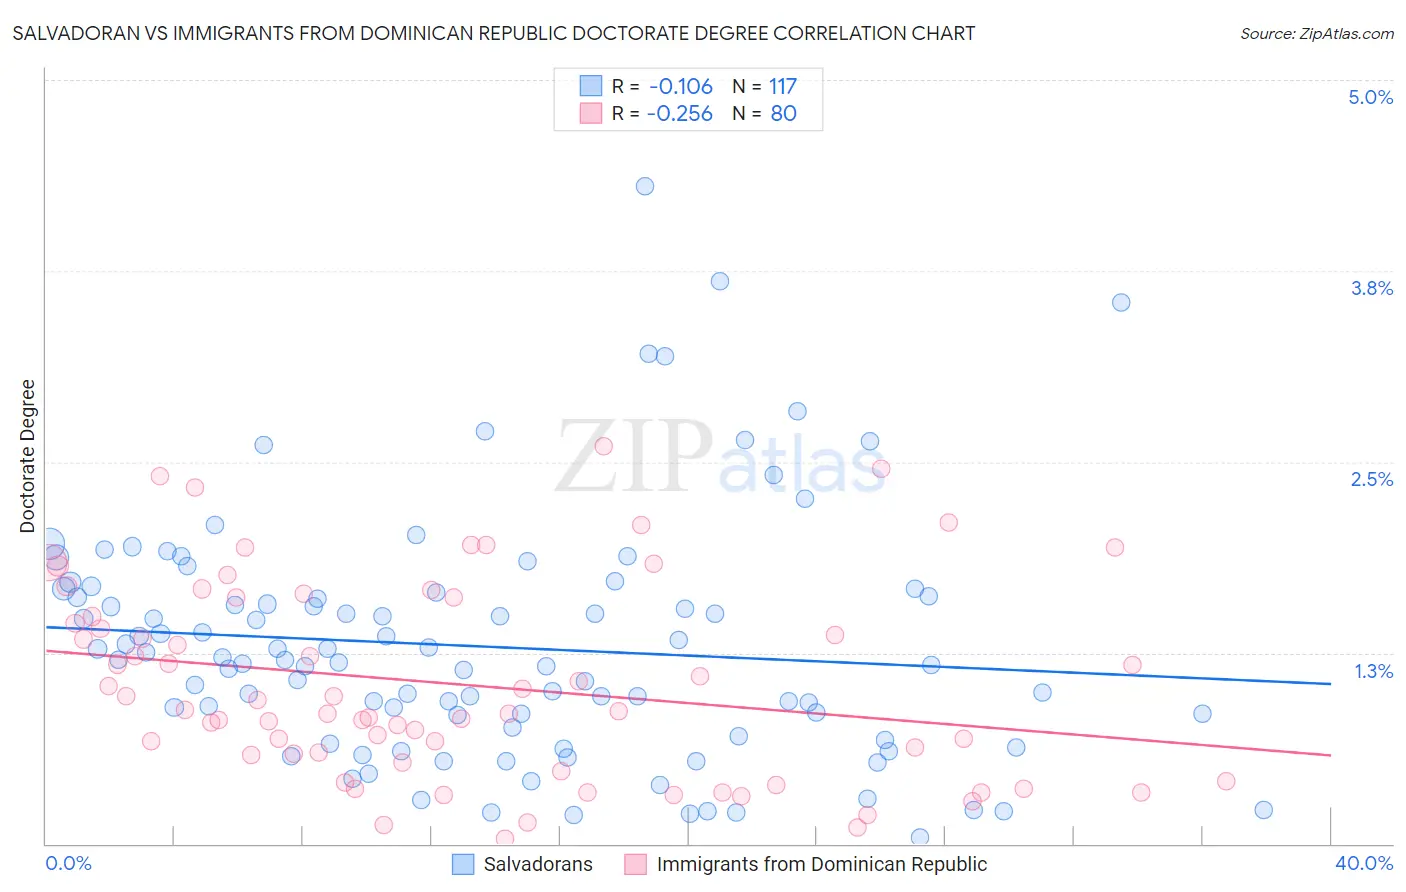
Salvadoran vs Immigrants from Dominican Republic Doctorate Degree Correlation Chart
The statistical analysis conducted on geographies consisting of 393,514,782 people shows a poor negative correlation between the proportion of Salvadorans and percentage of population with at least doctorate degree education in the United States with a correlation coefficient (R) of -0.106 and weighted average of 1.5%. Similarly, the statistical analysis conducted on geographies consisting of 273,260,616 people shows a weak negative correlation between the proportion of Immigrants from Dominican Republic and percentage of population with at least doctorate degree education in the United States with a correlation coefficient (R) of -0.256 and weighted average of 1.3%, a difference of 15.5%.
Doctorate Degree Correlation Summary
| Measurement | Salvadoran | Immigrants from Dominican Republic |
| Minimum | 0.038% | 0.033% |
| Maximum | 4.3% | 2.6% |
| Range | 4.3% | 2.6% |
| Mean | 1.3% | 1.0% |
| Median | 1.2% | 0.87% |
| Interquartile 25% (IQ1) | 0.74% | 0.56% |
| Interquartile 75% (IQ3) | 1.6% | 1.5% |
| Interquartile Range (IQR) | 0.90% | 0.99% |
| Standard Deviation (Sample) | 0.78% | 0.64% |
| Standard Deviation (Population) | 0.78% | 0.64% |
Similar Demographics by Doctorate Degree
Demographics Similar to Salvadorans by Doctorate Degree
In terms of doctorate degree, the demographic groups most similar to Salvadorans are Crow (1.5%, a difference of 0.030%), Immigrants from Trinidad and Tobago (1.5%, a difference of 0.070%), U.S. Virgin Islander (1.5%, a difference of 0.11%), Kiowa (1.5%, a difference of 0.12%), and Immigrants from Barbados (1.5%, a difference of 0.16%).
| Demographics | Rating | Rank | Doctorate Degree |
| Immigrants | Bahamas | 0.7 /100 | #263 | Tragic 1.5% |
| Blackfeet | 0.7 /100 | #264 | Tragic 1.5% |
| Nicaraguans | 0.6 /100 | #265 | Tragic 1.5% |
| Immigrants | Liberia | 0.5 /100 | #266 | Tragic 1.5% |
| Kiowa | 0.5 /100 | #267 | Tragic 1.5% |
| U.S. Virgin Islanders | 0.5 /100 | #268 | Tragic 1.5% |
| Crow | 0.5 /100 | #269 | Tragic 1.5% |
| Salvadorans | 0.5 /100 | #270 | Tragic 1.5% |
| Immigrants | Trinidad and Tobago | 0.5 /100 | #271 | Tragic 1.5% |
| Immigrants | Barbados | 0.4 /100 | #272 | Tragic 1.5% |
| Sioux | 0.4 /100 | #273 | Tragic 1.5% |
| Yaqui | 0.4 /100 | #274 | Tragic 1.5% |
| Aleuts | 0.4 /100 | #275 | Tragic 1.5% |
| Paiute | 0.4 /100 | #276 | Tragic 1.5% |
| Bahamians | 0.4 /100 | #277 | Tragic 1.5% |
Demographics Similar to Immigrants from Dominican Republic by Doctorate Degree
In terms of doctorate degree, the demographic groups most similar to Immigrants from Dominican Republic are Immigrants from Caribbean (1.3%, a difference of 0.19%), Yakama (1.3%, a difference of 0.35%), Immigrants from Haiti (1.3%, a difference of 1.8%), Immigrants from Latin America (1.3%, a difference of 1.9%), and Yup'ik (1.3%, a difference of 1.9%).
| Demographics | Rating | Rank | Doctorate Degree |
| Hispanics or Latinos | 0.0 /100 | #327 | Tragic 1.3% |
| Inupiat | 0.0 /100 | #328 | Tragic 1.3% |
| Haitians | 0.0 /100 | #329 | Tragic 1.3% |
| Yup'ik | 0.0 /100 | #330 | Tragic 1.3% |
| Immigrants | Latin America | 0.0 /100 | #331 | Tragic 1.3% |
| Yakama | 0.0 /100 | #332 | Tragic 1.3% |
| Immigrants | Caribbean | 0.0 /100 | #333 | Tragic 1.3% |
| Immigrants | Dominican Republic | 0.0 /100 | #334 | Tragic 1.3% |
| Immigrants | Haiti | 0.0 /100 | #335 | Tragic 1.3% |
| Nepalese | 0.0 /100 | #336 | Tragic 1.3% |
| Bangladeshis | 0.0 /100 | #337 | Tragic 1.2% |
| Puget Sound Salish | 0.0 /100 | #338 | Tragic 1.2% |
| Immigrants | Central America | 0.0 /100 | #339 | Tragic 1.2% |
| Immigrants | Cuba | 0.0 /100 | #340 | Tragic 1.2% |
| Mexicans | 0.0 /100 | #341 | Tragic 1.2% |