Alsatian vs Immigrants from Guatemala 5th Grade
COMPARE
Alsatian
Immigrants from Guatemala
5th Grade
5th Grade Comparison
Alsatians
Immigrants from Guatemala
97.4%
5TH GRADE
74.3/ 100
METRIC RATING
153rd/ 347
METRIC RANK
94.6%
5TH GRADE
0.0/ 100
METRIC RATING
345th/ 347
METRIC RANK
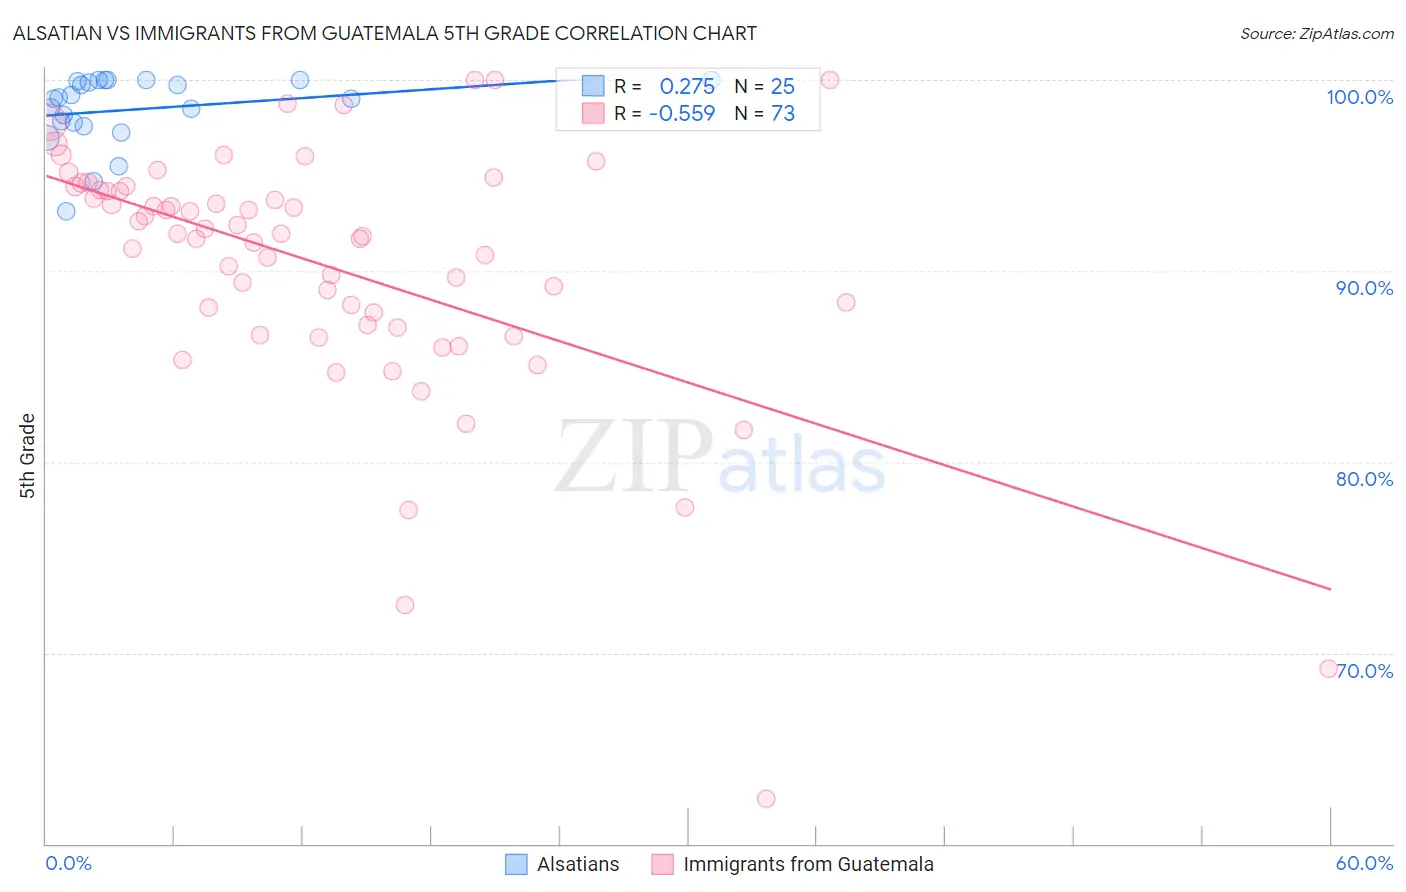
Alsatian vs Immigrants from Guatemala 5th Grade Correlation Chart
The statistical analysis conducted on geographies consisting of 82,682,365 people shows a weak positive correlation between the proportion of Alsatians and percentage of population with at least 5th grade education in the United States with a correlation coefficient (R) of 0.275 and weighted average of 97.4%. Similarly, the statistical analysis conducted on geographies consisting of 377,285,993 people shows a substantial negative correlation between the proportion of Immigrants from Guatemala and percentage of population with at least 5th grade education in the United States with a correlation coefficient (R) of -0.559 and weighted average of 94.6%, a difference of 3.0%.
5th Grade Correlation Summary
| Measurement | Alsatian | Immigrants from Guatemala |
| Minimum | 93.1% | 62.4% |
| Maximum | 100.0% | 100.0% |
| Range | 6.9% | 37.6% |
| Mean | 98.5% | 90.3% |
| Median | 99.0% | 92.0% |
| Interquartile 25% (IQ1) | 97.7% | 87.1% |
| Interquartile 75% (IQ3) | 100.0% | 94.3% |
| Interquartile Range (IQR) | 2.3% | 7.2% |
| Standard Deviation (Sample) | 1.8% | 6.7% |
| Standard Deviation (Population) | 1.8% | 6.7% |
Similar Demographics by 5th Grade
Demographics Similar to Alsatians by 5th Grade
In terms of 5th grade, the demographic groups most similar to Alsatians are Immigrants from Eastern Europe (97.4%, a difference of 0.0%), Ute (97.4%, a difference of 0.0%), Immigrants from South Central Asia (97.5%, a difference of 0.020%), Immigrants from Russia (97.4%, a difference of 0.020%), and Immigrants from Bosnia and Herzegovina (97.4%, a difference of 0.020%).
| Demographics | Rating | Rank | 5th Grade |
| Spaniards | 81.9 /100 | #146 | Excellent 97.5% |
| Soviet Union | 81.2 /100 | #147 | Excellent 97.5% |
| Immigrants | Israel | 79.1 /100 | #148 | Good 97.5% |
| Hopi | 78.6 /100 | #149 | Good 97.5% |
| Immigrants | South Central Asia | 78.6 /100 | #150 | Good 97.5% |
| Immigrants | Eastern Europe | 75.0 /100 | #151 | Good 97.4% |
| Ute | 74.9 /100 | #152 | Good 97.4% |
| Alsatians | 74.3 /100 | #153 | Good 97.4% |
| Immigrants | Russia | 71.2 /100 | #154 | Good 97.4% |
| Immigrants | Bosnia and Herzegovina | 71.0 /100 | #155 | Good 97.4% |
| French American Indians | 70.5 /100 | #156 | Good 97.4% |
| Immigrants | Jordan | 70.4 /100 | #157 | Good 97.4% |
| Albanians | 68.3 /100 | #158 | Good 97.4% |
| Immigrants | Italy | 65.2 /100 | #159 | Good 97.4% |
| Marshallese | 61.2 /100 | #160 | Good 97.4% |
Demographics Similar to Immigrants from Guatemala by 5th Grade
In terms of 5th grade, the demographic groups most similar to Immigrants from Guatemala are Salvadoran (94.6%, a difference of 0.010%), Immigrants from Mexico (94.6%, a difference of 0.010%), Immigrants from Central America (94.7%, a difference of 0.060%), Yakama (94.8%, a difference of 0.16%), and Guatemalan (94.8%, a difference of 0.24%).
| Demographics | Rating | Rank | 5th Grade |
| Immigrants | Latin America | 0.0 /100 | #333 | Tragic 95.3% |
| Nepalese | 0.0 /100 | #334 | Tragic 95.2% |
| Mexicans | 0.0 /100 | #335 | Tragic 95.2% |
| Immigrants | Azores | 0.0 /100 | #336 | Tragic 95.1% |
| Central Americans | 0.0 /100 | #337 | Tragic 95.1% |
| Immigrants | Cabo Verde | 0.0 /100 | #338 | Tragic 94.9% |
| Immigrants | Yemen | 0.0 /100 | #339 | Tragic 94.9% |
| Guatemalans | 0.0 /100 | #340 | Tragic 94.8% |
| Yakama | 0.0 /100 | #341 | Tragic 94.8% |
| Immigrants | Central America | 0.0 /100 | #342 | Tragic 94.7% |
| Salvadorans | 0.0 /100 | #343 | Tragic 94.6% |
| Immigrants | Mexico | 0.0 /100 | #344 | Tragic 94.6% |
| Immigrants | Guatemala | 0.0 /100 | #345 | Tragic 94.6% |
| Immigrants | El Salvador | 0.0 /100 | #346 | Tragic 94.3% |
| Spanish American Indians | 0.0 /100 | #347 | Tragic 94.2% |