Japanese vs Czechoslovakian 5th Grade
COMPARE
Japanese
Czechoslovakian
5th Grade
5th Grade Comparison
Japanese
Czechoslovakians
95.7%
5TH GRADE
0.0/ 100
METRIC RATING
319th/ 347
METRIC RANK
98.0%
5TH GRADE
99.9/ 100
METRIC RATING
45th/ 347
METRIC RANK
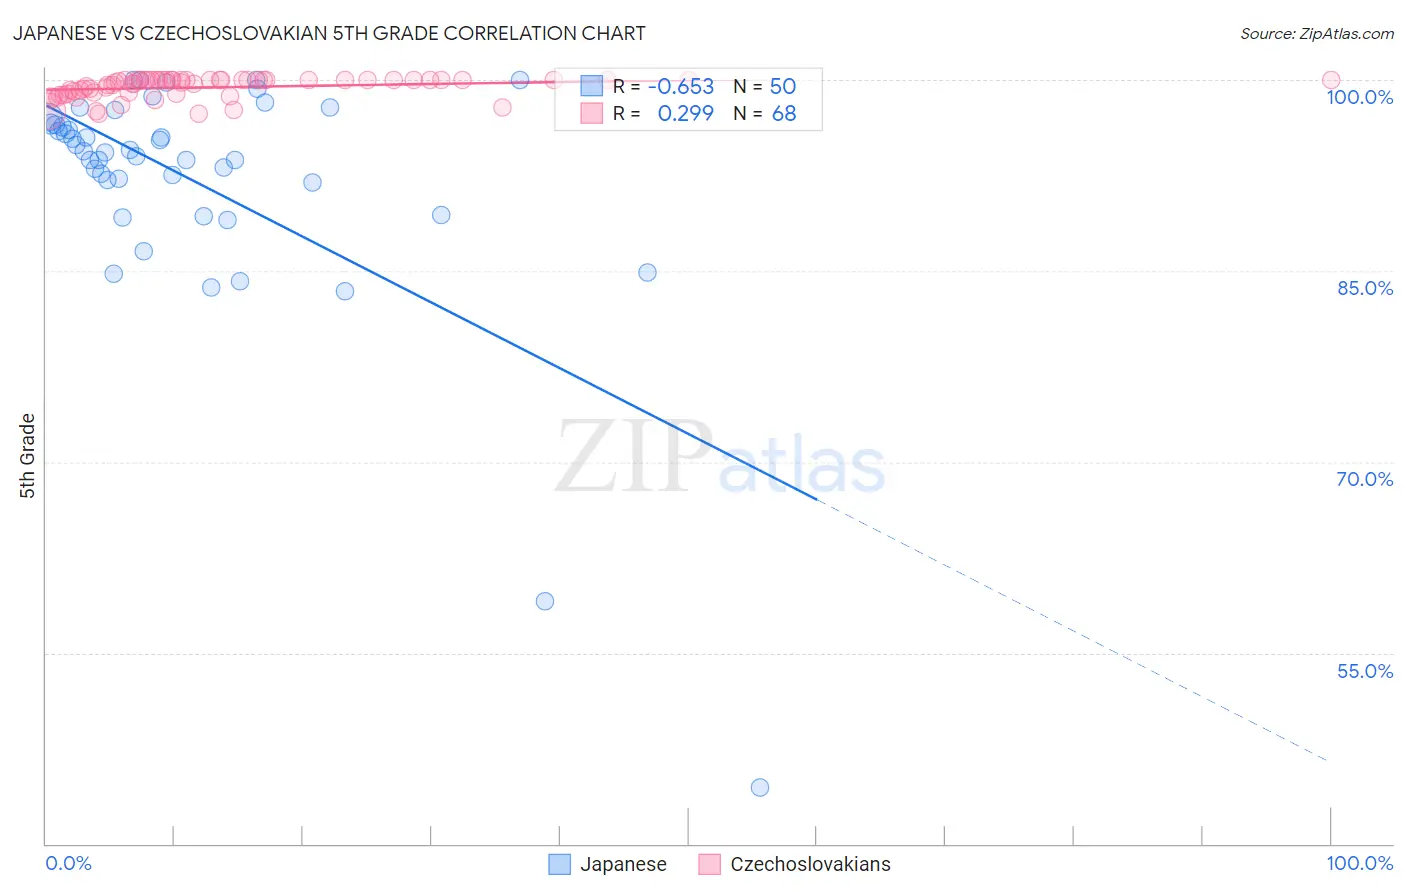
Japanese vs Czechoslovakian 5th Grade Correlation Chart
The statistical analysis conducted on geographies consisting of 249,183,224 people shows a significant negative correlation between the proportion of Japanese and percentage of population with at least 5th grade education in the United States with a correlation coefficient (R) of -0.653 and weighted average of 95.7%. Similarly, the statistical analysis conducted on geographies consisting of 368,657,544 people shows a weak positive correlation between the proportion of Czechoslovakians and percentage of population with at least 5th grade education in the United States with a correlation coefficient (R) of 0.299 and weighted average of 98.0%, a difference of 2.4%.
5th Grade Correlation Summary
| Measurement | Japanese | Czechoslovakian |
| Minimum | 44.4% | 97.3% |
| Maximum | 100.0% | 100.0% |
| Range | 55.6% | 2.7% |
| Mean | 92.2% | 99.4% |
| Median | 94.4% | 99.9% |
| Interquartile 25% (IQ1) | 92.0% | 99.0% |
| Interquartile 75% (IQ3) | 96.5% | 100.0% |
| Interquartile Range (IQR) | 4.5% | 1.0% |
| Standard Deviation (Sample) | 9.6% | 0.78% |
| Standard Deviation (Population) | 9.5% | 0.78% |
Similar Demographics by 5th Grade
Demographics Similar to Japanese by 5th Grade
In terms of 5th grade, the demographic groups most similar to Japanese are Central American Indian (95.7%, a difference of 0.0%), Immigrants from Vietnam (95.8%, a difference of 0.050%), Belizean (95.8%, a difference of 0.070%), Immigrants from Belize (95.7%, a difference of 0.080%), and Immigrants from Nicaragua (95.6%, a difference of 0.090%).
| Demographics | Rating | Rank | 5th Grade |
| Vietnamese | 0.0 /100 | #312 | Tragic 95.9% |
| Bangladeshis | 0.0 /100 | #313 | Tragic 95.9% |
| Immigrants | Portugal | 0.0 /100 | #314 | Tragic 95.9% |
| Nicaraguans | 0.0 /100 | #315 | Tragic 95.9% |
| Immigrants | Ecuador | 0.0 /100 | #316 | Tragic 95.8% |
| Belizeans | 0.0 /100 | #317 | Tragic 95.8% |
| Immigrants | Vietnam | 0.0 /100 | #318 | Tragic 95.8% |
| Japanese | 0.0 /100 | #319 | Tragic 95.7% |
| Central American Indians | 0.0 /100 | #320 | Tragic 95.7% |
| Immigrants | Belize | 0.0 /100 | #321 | Tragic 95.7% |
| Immigrants | Nicaragua | 0.0 /100 | #322 | Tragic 95.6% |
| Immigrants | Fiji | 0.0 /100 | #323 | Tragic 95.6% |
| Hondurans | 0.0 /100 | #324 | Tragic 95.6% |
| Hispanics or Latinos | 0.0 /100 | #325 | Tragic 95.6% |
| Immigrants | Cambodia | 0.0 /100 | #326 | Tragic 95.5% |
Demographics Similar to Czechoslovakians by 5th Grade
In terms of 5th grade, the demographic groups most similar to Czechoslovakians are Arapaho (98.0%, a difference of 0.0%), Aleut (98.0%, a difference of 0.010%), Native Hawaiian (98.0%, a difference of 0.010%), Ottawa (98.0%, a difference of 0.020%), and Bulgarian (98.0%, a difference of 0.020%).
| Demographics | Rating | Rank | 5th Grade |
| Belgians | 99.9 /100 | #38 | Exceptional 98.1% |
| Luxembourgers | 99.9 /100 | #39 | Exceptional 98.1% |
| Eastern Europeans | 99.9 /100 | #40 | Exceptional 98.1% |
| Hungarians | 99.9 /100 | #41 | Exceptional 98.0% |
| Northern Europeans | 99.9 /100 | #42 | Exceptional 98.0% |
| Ottawa | 99.9 /100 | #43 | Exceptional 98.0% |
| Aleuts | 99.9 /100 | #44 | Exceptional 98.0% |
| Czechoslovakians | 99.9 /100 | #45 | Exceptional 98.0% |
| Arapaho | 99.9 /100 | #46 | Exceptional 98.0% |
| Native Hawaiians | 99.9 /100 | #47 | Exceptional 98.0% |
| Bulgarians | 99.8 /100 | #48 | Exceptional 98.0% |
| Estonians | 99.8 /100 | #49 | Exceptional 98.0% |
| Immigrants | Scotland | 99.8 /100 | #50 | Exceptional 98.0% |
| Celtics | 99.8 /100 | #51 | Exceptional 98.0% |
| Maltese | 99.8 /100 | #52 | Exceptional 98.0% |