Aleut vs Indonesian Bachelor's Degree
COMPARE
Aleut
Indonesian
Bachelor's Degree
Bachelor's Degree Comparison
Aleuts
Indonesians
31.3%
BACHELOR'S DEGREE
0.1/ 100
METRIC RATING
285th/ 347
METRIC RANK
33.5%
BACHELOR'S DEGREE
0.9/ 100
METRIC RATING
250th/ 347
METRIC RANK
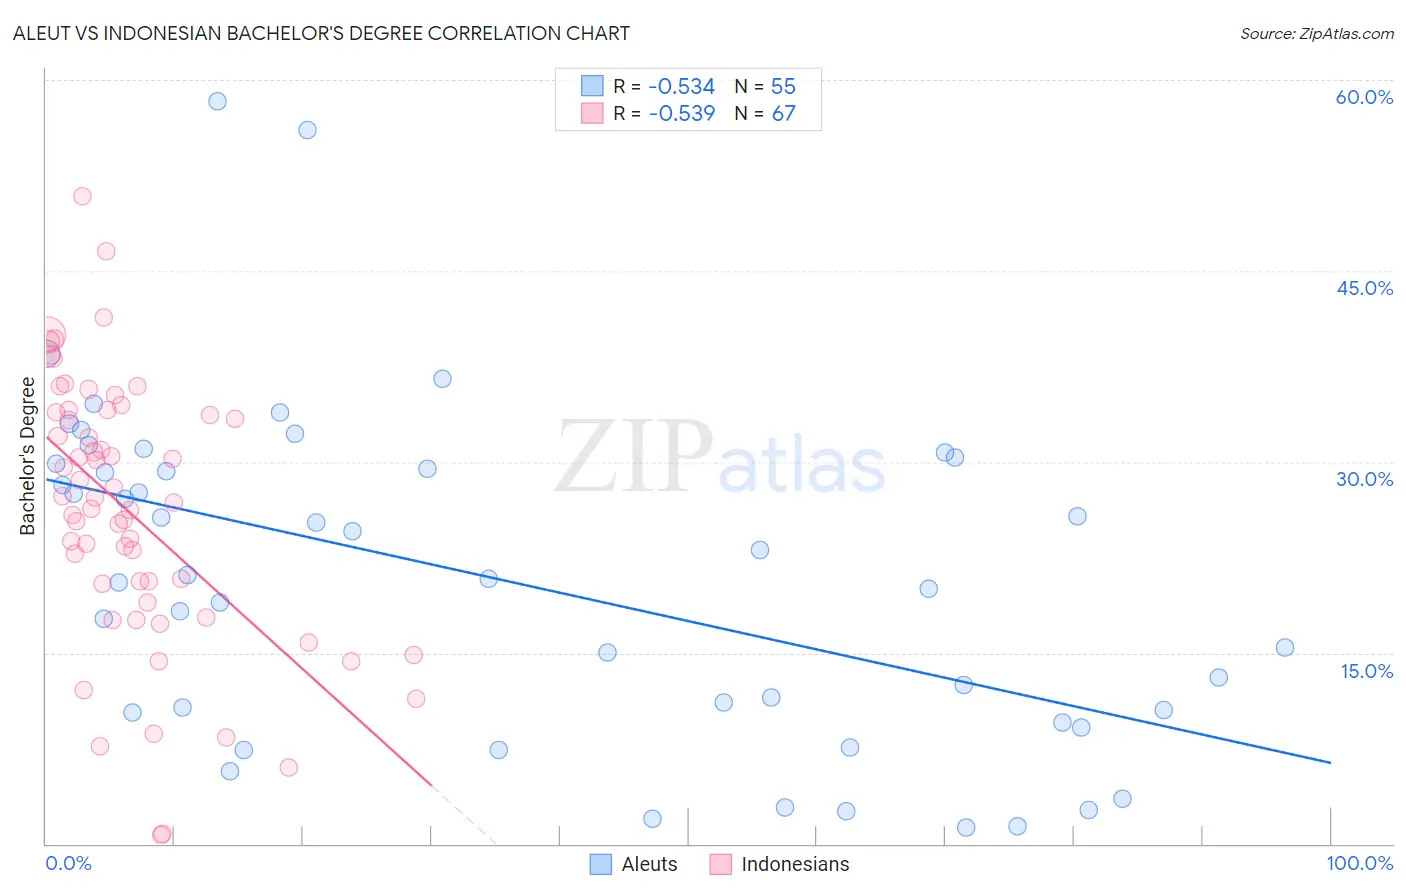
Aleut vs Indonesian Bachelor's Degree Correlation Chart
The statistical analysis conducted on geographies consisting of 61,782,473 people shows a substantial negative correlation between the proportion of Aleuts and percentage of population with at least bachelor's degree education in the United States with a correlation coefficient (R) of -0.534 and weighted average of 31.3%. Similarly, the statistical analysis conducted on geographies consisting of 162,716,505 people shows a substantial negative correlation between the proportion of Indonesians and percentage of population with at least bachelor's degree education in the United States with a correlation coefficient (R) of -0.539 and weighted average of 33.5%, a difference of 7.1%.
Bachelor's Degree Correlation Summary
| Measurement | Aleut | Indonesian |
| Minimum | 1.3% | 0.73% |
| Maximum | 58.3% | 50.9% |
| Range | 57.1% | 50.2% |
| Mean | 20.8% | 26.1% |
| Median | 20.9% | 26.9% |
| Interquartile 25% (IQ1) | 10.3% | 19.0% |
| Interquartile 75% (IQ3) | 29.9% | 33.9% |
| Interquartile Range (IQR) | 19.5% | 14.9% |
| Standard Deviation (Sample) | 13.0% | 10.5% |
| Standard Deviation (Population) | 12.9% | 10.4% |
Similar Demographics by Bachelor's Degree
Demographics Similar to Aleuts by Bachelor's Degree
In terms of bachelor's degree, the demographic groups most similar to Aleuts are Haitian (31.3%, a difference of 0.010%), Honduran (31.3%, a difference of 0.040%), Immigrants from El Salvador (31.3%, a difference of 0.050%), Immigrants from Caribbean (31.4%, a difference of 0.32%), and Blackfeet (31.5%, a difference of 0.47%).
| Demographics | Rating | Rank | Bachelor's Degree |
| Marshallese | 0.1 /100 | #278 | Tragic 31.7% |
| Hawaiians | 0.1 /100 | #279 | Tragic 31.6% |
| Immigrants | Laos | 0.1 /100 | #280 | Tragic 31.6% |
| Blackfeet | 0.1 /100 | #281 | Tragic 31.5% |
| Immigrants | Caribbean | 0.1 /100 | #282 | Tragic 31.4% |
| Hondurans | 0.1 /100 | #283 | Tragic 31.3% |
| Haitians | 0.1 /100 | #284 | Tragic 31.3% |
| Aleuts | 0.1 /100 | #285 | Tragic 31.3% |
| Immigrants | El Salvador | 0.1 /100 | #286 | Tragic 31.3% |
| Ottawa | 0.1 /100 | #287 | Tragic 31.1% |
| Guatemalans | 0.1 /100 | #288 | Tragic 31.0% |
| Puerto Ricans | 0.1 /100 | #289 | Tragic 31.0% |
| Immigrants | Honduras | 0.1 /100 | #290 | Tragic 30.9% |
| Blacks/African Americans | 0.1 /100 | #291 | Tragic 30.9% |
| Ute | 0.1 /100 | #292 | Tragic 30.9% |
Demographics Similar to Indonesians by Bachelor's Degree
In terms of bachelor's degree, the demographic groups most similar to Indonesians are Immigrants from Liberia (33.5%, a difference of 0.010%), Cree (33.6%, a difference of 0.13%), Immigrants from Congo (33.6%, a difference of 0.15%), Jamaican (33.6%, a difference of 0.24%), and Immigrants from Fiji (33.7%, a difference of 0.60%).
| Demographics | Rating | Rank | Bachelor's Degree |
| Immigrants | Guyana | 1.4 /100 | #243 | Tragic 33.9% |
| Delaware | 1.2 /100 | #244 | Tragic 33.8% |
| Immigrants | Fiji | 1.2 /100 | #245 | Tragic 33.7% |
| Jamaicans | 1.0 /100 | #246 | Tragic 33.6% |
| Immigrants | Congo | 1.0 /100 | #247 | Tragic 33.6% |
| Cree | 1.0 /100 | #248 | Tragic 33.6% |
| Immigrants | Liberia | 0.9 /100 | #249 | Tragic 33.5% |
| Indonesians | 0.9 /100 | #250 | Tragic 33.5% |
| Japanese | 0.7 /100 | #251 | Tragic 33.3% |
| Immigrants | Bahamas | 0.7 /100 | #252 | Tragic 33.3% |
| U.S. Virgin Islanders | 0.7 /100 | #253 | Tragic 33.2% |
| Native Hawaiians | 0.7 /100 | #254 | Tragic 33.2% |
| Iroquois | 0.7 /100 | #255 | Tragic 33.2% |
| Nicaraguans | 0.6 /100 | #256 | Tragic 33.1% |
| Spanish Americans | 0.6 /100 | #257 | Tragic 33.1% |