Yuman vs Indonesian Bachelor's Degree
COMPARE
Yuman
Indonesian
Bachelor's Degree
Bachelor's Degree Comparison
Yuman
Indonesians
24.5%
BACHELOR'S DEGREE
0.0/ 100
METRIC RATING
341st/ 347
METRIC RANK
33.5%
BACHELOR'S DEGREE
0.9/ 100
METRIC RATING
250th/ 347
METRIC RANK
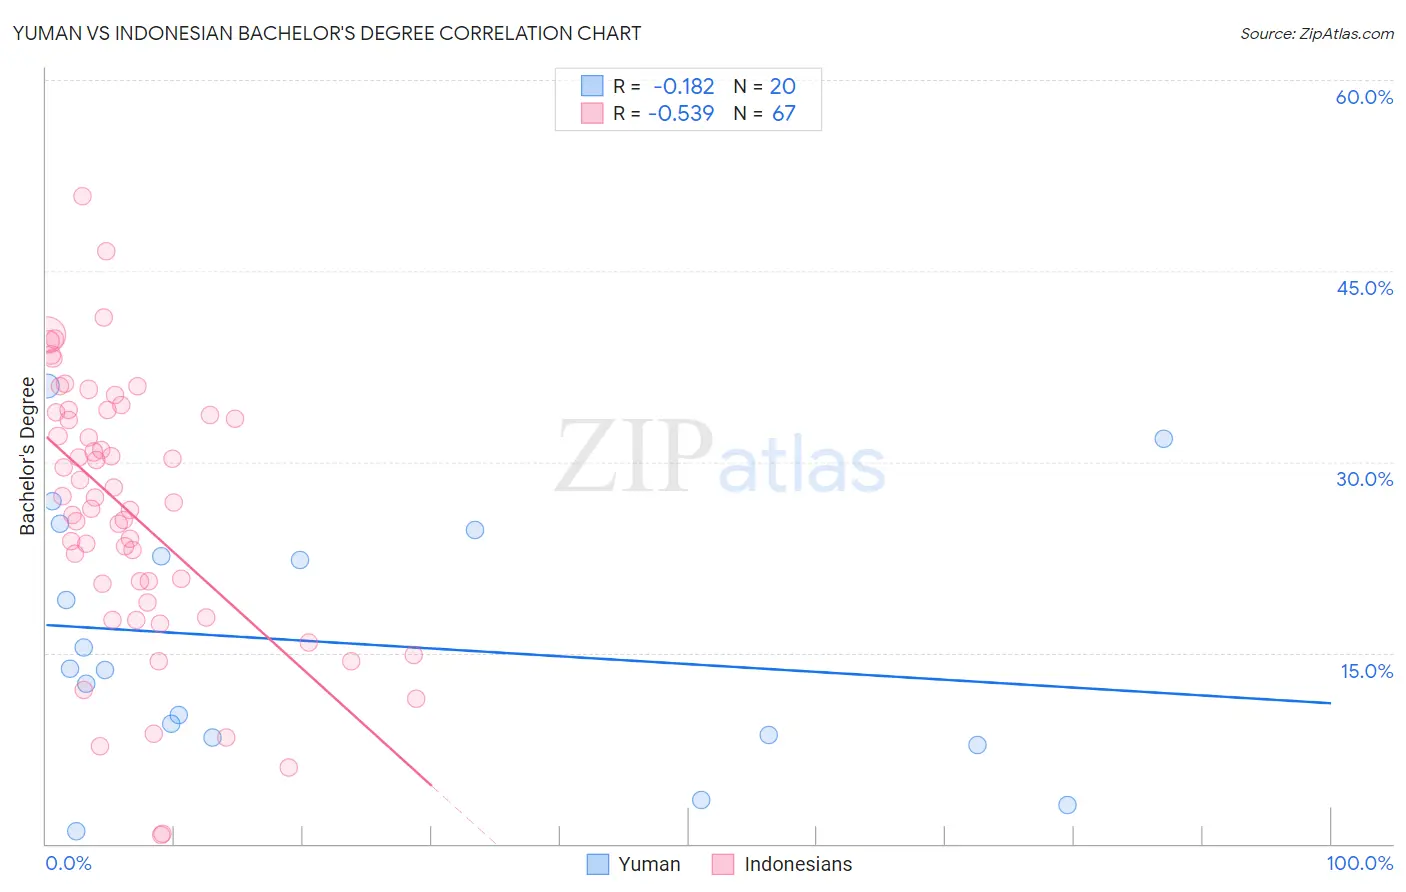
Yuman vs Indonesian Bachelor's Degree Correlation Chart
The statistical analysis conducted on geographies consisting of 40,695,853 people shows a poor negative correlation between the proportion of Yuman and percentage of population with at least bachelor's degree education in the United States with a correlation coefficient (R) of -0.182 and weighted average of 24.5%. Similarly, the statistical analysis conducted on geographies consisting of 162,716,505 people shows a substantial negative correlation between the proportion of Indonesians and percentage of population with at least bachelor's degree education in the United States with a correlation coefficient (R) of -0.539 and weighted average of 33.5%, a difference of 36.7%.
Bachelor's Degree Correlation Summary
| Measurement | Yuman | Indonesian |
| Minimum | 0.96% | 0.73% |
| Maximum | 36.0% | 50.9% |
| Range | 35.0% | 50.2% |
| Mean | 15.8% | 26.1% |
| Median | 13.7% | 26.9% |
| Interquartile 25% (IQ1) | 8.4% | 19.0% |
| Interquartile 75% (IQ3) | 23.6% | 33.9% |
| Interquartile Range (IQR) | 15.2% | 14.9% |
| Standard Deviation (Sample) | 9.9% | 10.5% |
| Standard Deviation (Population) | 9.6% | 10.4% |
Similar Demographics by Bachelor's Degree
Demographics Similar to Yuman by Bachelor's Degree
In terms of bachelor's degree, the demographic groups most similar to Yuman are Yakama (24.5%, a difference of 0.27%), Tohono O'odham (24.4%, a difference of 0.47%), Lumbee (24.8%, a difference of 0.92%), Hopi (25.3%, a difference of 3.1%), and Navajo (23.6%, a difference of 3.9%).
| Demographics | Rating | Rank | Bachelor's Degree |
| Mexicans | 0.0 /100 | #333 | Tragic 27.1% |
| Arapaho | 0.0 /100 | #334 | Tragic 26.6% |
| Natives/Alaskans | 0.0 /100 | #335 | Tragic 26.3% |
| Immigrants | Mexico | 0.0 /100 | #336 | Tragic 26.1% |
| Inupiat | 0.0 /100 | #337 | Tragic 25.8% |
| Pueblo | 0.0 /100 | #338 | Tragic 25.5% |
| Hopi | 0.0 /100 | #339 | Tragic 25.3% |
| Lumbee | 0.0 /100 | #340 | Tragic 24.8% |
| Yuman | 0.0 /100 | #341 | Tragic 24.5% |
| Yakama | 0.0 /100 | #342 | Tragic 24.5% |
| Tohono O'odham | 0.0 /100 | #343 | Tragic 24.4% |
| Navajo | 0.0 /100 | #344 | Tragic 23.6% |
| Pima | 0.0 /100 | #345 | Tragic 23.2% |
| Houma | 0.0 /100 | #346 | Tragic 21.4% |
| Yup'ik | 0.0 /100 | #347 | Tragic 19.4% |
Demographics Similar to Indonesians by Bachelor's Degree
In terms of bachelor's degree, the demographic groups most similar to Indonesians are Immigrants from Liberia (33.5%, a difference of 0.010%), Cree (33.6%, a difference of 0.13%), Immigrants from Congo (33.6%, a difference of 0.15%), Jamaican (33.6%, a difference of 0.24%), and Immigrants from Fiji (33.7%, a difference of 0.60%).
| Demographics | Rating | Rank | Bachelor's Degree |
| Immigrants | Guyana | 1.4 /100 | #243 | Tragic 33.9% |
| Delaware | 1.2 /100 | #244 | Tragic 33.8% |
| Immigrants | Fiji | 1.2 /100 | #245 | Tragic 33.7% |
| Jamaicans | 1.0 /100 | #246 | Tragic 33.6% |
| Immigrants | Congo | 1.0 /100 | #247 | Tragic 33.6% |
| Cree | 1.0 /100 | #248 | Tragic 33.6% |
| Immigrants | Liberia | 0.9 /100 | #249 | Tragic 33.5% |
| Indonesians | 0.9 /100 | #250 | Tragic 33.5% |
| Japanese | 0.7 /100 | #251 | Tragic 33.3% |
| Immigrants | Bahamas | 0.7 /100 | #252 | Tragic 33.3% |
| U.S. Virgin Islanders | 0.7 /100 | #253 | Tragic 33.2% |
| Native Hawaiians | 0.7 /100 | #254 | Tragic 33.2% |
| Iroquois | 0.7 /100 | #255 | Tragic 33.2% |
| Nicaraguans | 0.6 /100 | #256 | Tragic 33.1% |
| Spanish Americans | 0.6 /100 | #257 | Tragic 33.1% |